Chapter 9. Getting named at the category door
By the end of this chapter you will know what the first gate actually tests, which properties of the evidence about a company plausibly determine whether it clears that gate, and one measured result that overturns the most common excuse for not clearing it.
The claim this chapter defends
Measured, Volume II. Companies named in zero of ten answers lost category-level questions, meaning best-of shortlists plus alternatives-to-incumbent queries, 55.3% of the time, across 30 companies and 300 absence records. Reasoned. The first gate is membership, not preference. More than half of what a zero-visibility company loses is questions that never mention a competitor by name and simply ask who exists. The work implied is therefore about being recognisable as a member of a set, and this chapter is about what that requires of the evidence rather than about tactics for producing it.
Operator disclosure. Broadcastwell ran this measurement and sells services in the category it measures. Broadcastwell is excluded from the measured sample and from every ranking. The mitigation is not that the conflict is absent, it is that the raw data and the code are public and the result can be recomputed by anyone who disagrees.
What the category door actually tests
Measured, Volume II. At the zero tier, 55.3% of absences were category-level and 20.0% were head-to-head comparisons. At the seven-and-above tier those proportions reverse to 12.5% and 68.8%. Reasoned. A company failing at the door is not losing an argument against a rival. It is not in the room where the argument happens. The engine, assembling a set of candidates before it writes anything, does not include it. Nothing about product quality, pricing or positioning is being adjudicated at that point, because adjudication happens later.
The strong-incumbent excuse does not survive the data
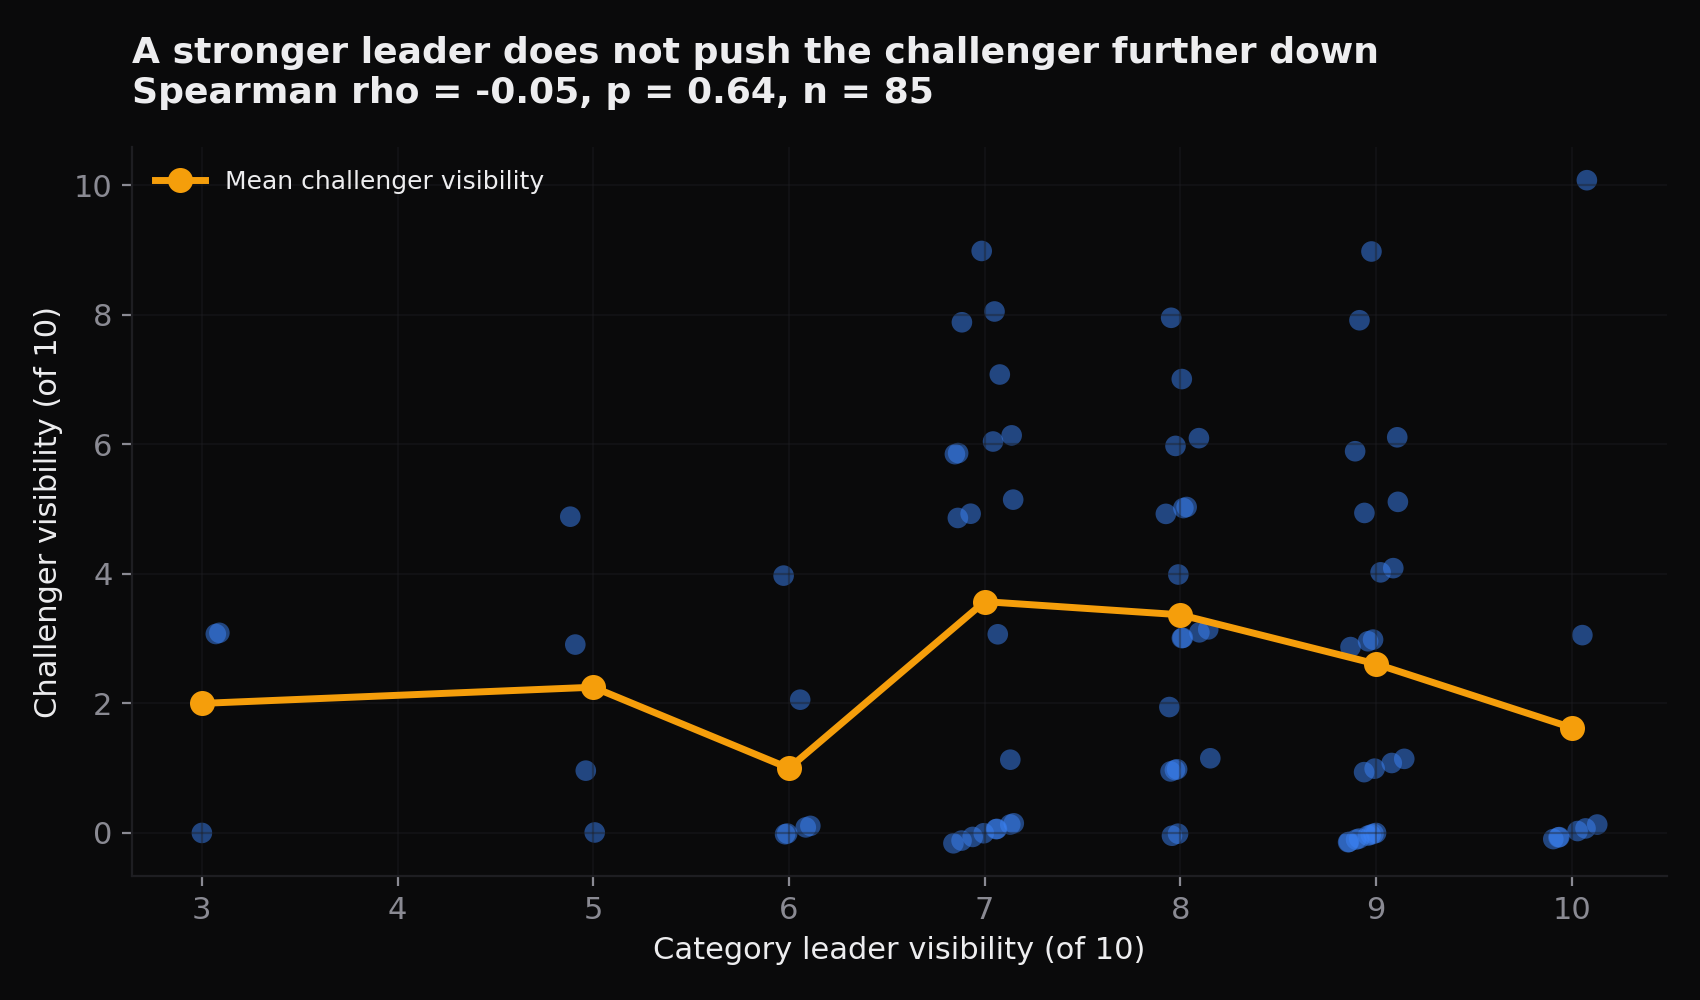
Measured, Volume II. The Spearman correlation between category leader visibility and challenger visibility was −0.051 at p = 0.64 over 85 companies. Reasoned. A dominant incumbent does not crowd the challenger out. The most common explanation offered for zero visibility, that the category is owned by somebody else, has no support here.
The counterintuitive part is which categories are worst
Measured, Volume II. Challenger mean visibility was 2.35 where the leader scored 9 or 10, 3.48 where the leader scored 7 or 8, and 1.57 where the leader scored 6 or below, with a Kruskal-Wallis result across those bands at p = 0.052. Measured, Volume II. In seven of the 85 company sweeps no brand scored above 5 of 10, and challengers in those categories did worst. Reasoned. Challengers did worst in weakly defined categories, not in strongly dominated ones. Volume II offers the plausible reading that a category with an obvious leader is one the engine models well enough to name a second and third option, and reports it as a null result to be retested rather than as a finding.
What that implies about the first job
Reasoned. If a weakly modelled category suppresses everyone in it, then part of the work at the category door is not about the company at all. It is about whether the category itself is legible: whether it has a stable name, whether sources describe it consistently, and whether a set of vendors is routinely enumerated within it. A company trying to be selected into a set that the engine does not cleanly recognise is solving the wrong problem first. This is inference from a null result and should be held loosely.
Standard one: the entity is unambiguous
Reasoned. An engine assembling candidates has to resolve a name to a company. Names that collide with ordinary words, with other companies, or with product lines create resolution failures that no amount of publishing fixes. Volume III's scoring rules take the same problem seriously from the measurement side: brand matching is case-sensitive for a single plain alphabetic word precisely so that a company called Pitch does not match the verb. If a measurement has to work that hard to identify you, so does a retrieval system.
Standard two: the category attachment exists outside your own pages
Measured, Volume II. Volume II's stated practical consequence for companies at the door is entity presence and inclusion in the third-party sources engines consult when assembling a set. Reasoned. The operative words are third-party. A company's own site asserting membership of a category is an assertion. The same claim appearing in sources the company does not control is corroboration, and corroboration is what a set-assembly step can act on without taking one vendor's word for it. This is a standard about where the claim lives, not about how much of it there is.
Standard three: corroboration is broad rather than placed
Measured, Volume I. The top 10 cited domains held only 12% of citations and 56% of cited domains appeared exactly once. Reasoned. A fragmented evidence layer means there is no small set of outlets to win. Presence in any one of them is a small contribution, and the plausible route is breadth: the same description of you, as a vendor of a specific thing, existing in many independent places. Chapter 4 at /who-gets-cited/ has the underlying composition, and this standard follows from it rather than from any tested intervention.
Standard four: the description is consistent across sources
Reasoned. If three sources describe a company three different ways, each one contributes to a different possible category attachment and none accumulates. Consistency here is not a branding preference, it is what allows independent mentions to reinforce rather than fragment. This is the least testable standard in the chapter, because nothing in the three volumes measures description consistency, and it is included as inference with that stated plainly.
The size of the group standing at the door
Measured, Volume II. 35.3% of the companies measured were named zero times in their own category, the median challenger scored 2 of 10 with a mean of 2.75, and the median category leader scored 8 of 10 with a mean of 7.73. Measured, Volume II. The median leader-minus-challenger gap was 5 points, and in 23.5% of sweeps the gap was 8 points or more. Reasoned. The door is where most of this sample is standing. A five-point median gap between the leader and the challenger in the same category is not a matter of relative preference among candidates, it is one company being routinely assembled into sets and another routinely not.
The extreme case, and why it is not about competition
Measured, Volume II. In 16 sweeps the challenger scored zero while the leader scored 8 or above. Reasoned. Read alongside the null result on leader strength, those 16 cases are not evidence that the leader displaced the challenger, because across the full sample leader strength does not predict challenger visibility at all. The more consistent reading is that the two companies differ in whether the engine recognises them as members of the category, and that the leader's score is a symptom of the same recognition rather than a cause of the challenger's absence.
Standard five: the evidence is reachable without a form
Reasoned. An engine assembling a candidate set issues plain requests. Material behind a form, a login or a download gate is not readable by the process that decides whether you exist in a category, whatever its value to a human reader who has already found you. This is the same reasoning that keeps this manual ungated, and it is the one standard in the chapter that is a direct consequence of how retrieval works rather than an inference from measured outcomes.
Standard six: being quotable is not enough
Measured, Volume II. Nine companies were named zero times while their own domain was cited as a source, one of them in five of its ten answers. Reasoned. These companies cleared every bar related to being findable and useful, and still failed at the door. Whatever the door tests, it is not whether your material can be retrieved and quoted. Chapter 3 at /cited-not-recommended/ covers this group in full, and it is the clearest evidence that content supply and category membership are separate problems.
What the ladder says about sequencing
Measured, Volume II. The absence mix moves monotonically across all four visibility tiers, with category-level absence falling from 55.3% to 48.2% to 20.8% to 12.5% while comparison absence rises from 20.0% to 24.6% to 41.6% to 68.8%. Reasoned. That ordering is consistent with two gates cleared in sequence rather than worked on in parallel. It implies that comparison work performed by a company at the door will be read by very few buyers, because the answers where comparisons happen are answers the company is not appearing in. Chapter 10 at /comparison-gate/ is the second gate.
How you know you are at the door
Reasoned. Take the questions you were not named in, sort them into shapes using the published rules in Appendix B at /absence-rules/, then collapse best-of and alternatives-to-incumbent into one category-level bucket. If that bucket dominates, you are at the door. This is the same diagnostic as Chapter 2 at /absence-ladder/ and it requires no tool, only that you kept the text of the questions you lost.
What clearing the door does not get you
Measured, Volume II. Companies at the top tier still lost 16 answers between them, of which 68.8% were head-to-head comparisons. Reasoned. The door is a necessary condition and not a sufficient one. A company that becomes a recognised member of its category has changed which questions it loses rather than stopped losing. Any supplier promising that category-presence work produces recommendation is promising something the two-gate structure does not support.
Why the door is cheaper to clear than it looks
Measured, Volume II. The step from the zero tier to the 1 to 3 tier moves category-level absence from 55.3% to 48.2%, while the step from 1 to 3 up to 4 to 6 moves it from 48.2% to 20.8%. Reasoned. The largest change in the mix happens in the middle of the range rather than at the very bottom, which is consistent with recognition being something that accumulates and then tips rather than something bought one mention at a time. If that reading is right, the discouraging part is that early effort shows little movement, and the encouraging part is that the movement, when it comes, is not incremental. Both halves of that are inference from a cross-section and neither is a promise.
The honest limit on everything in this chapter
Reasoned. Nothing in the three volumes is an intervention study. No company was measured, changed and measured again, so none of the six standards above has been shown to move a visibility score. They are inferences from a cross-sectional pattern plus one null result, and they are labelled as inference for that reason. A supplier presenting the same standards as proven mechanisms is overstating what the evidence supports, and so would this chapter if it did the same.
What would falsify these standards
Reasoned. A published before-and-after on a fixed question set, with repeat runs and both naming and citation columns reported, in which a company at the door increased third-party category corroboration and did not move. That test is cheap, nobody has published it, and until somebody does the standards in this chapter remain plausible rather than demonstrated. This manual will link to the first credible one that appears, including one that contradicts it.
What this means for your buying decision
Reasoned. Establish which gate you are at before you buy work aimed at either. If category-level questions dominate your absence list, ask a supplier what evidence about you will exist outside your own domain when the engagement ends, and in how many independent places. Treat any proposal that answers mainly in terms of pages published on your own site as aimed at the wrong gate. And discount heavily any claim that your problem is a strong incumbent. Chapter 12 at /how-to-buy-geo/ has the question list.
Where to go next
Reasoned. Chapter 10 at /comparison-gate/ covers the second gate and what content a model can lift a claim from. Chapter 11 at /how-long-it-takes/ is honest about cadence and about how little the volumes can say on elapsed time. Chapter 2 at /absence-ladder/ is the measured basis for the two-gate model.
Sources
The measured figures in this chapter come from The 2026 State of GEO, Volume II: the absence ladder table across all four tiers, the leader null result with its Spearman correlation and Kruskal-Wallis band comparison, the seven sweeps in which no brand scored above 5 of 10, the nine companies cited but never named, and Volume II's own stated practical consequence for companies at the door. The fragmentation figures on the citation layer are Volume I. Everything is at github.com/Broadcastwell/state-of-geo-2026.
About this manual
Author. Sairam Sivakumar, Broadcastwell.
Operator disclosure. Broadcastwell ran this measurement and sells services in the category it measures. Broadcastwell is excluded from the measured sample and from every ranking. The mitigation is not that the conflict is absent, it is that the raw data and the code are public and the result can be recomputed by anyone who disagrees.
Historical research record. The dated collection designs and source files remain available in the published research repository and the three volumes linked below. The July 2026 collection used four engines and five runs per question; the 18 August 2026 collection used the same ten questions and four engines, with one run per question.
Reading dated measurements. Reasoned. Compare like with like. A change in the number of runs changes the evidence base, even when the questions and engines are unchanged. Keep the collection date, question wording, engine, run count and exclusions beside any result. Inspect the retained answers and sources before interpreting a difference as movement. Naming and citation answer different questions, so report them separately. A dated observation supports a claim about that collection; it does not establish a current result or prove that an intervention caused a change.
Not peer reviewed. This is an independent industry study published as an open dataset with the analysis code that produced every figure in it. It has not been through academic peer review. Read it as measurement, and check the measurement. If you disagree with a number here, recompute it from the public data and publish what you get.
Licence. Prose and figures CC BY 4.0. Site code MIT.
The three volumes.
| Volume | What it covers | DOI |
|---|---|---|
| Volume I | 85 companies, 61 categories, 860 scored answers and 5,160 citations, one engine held constant. The dataset README additionally records 1,753 unique domains cited | 10.5281/zenodo.21537014 |
| Volume II | The Absence Ladder. All 616 absence records classified by question shape | 10.5281/zenodo.21586091 |
| Volume III | Cross-engine divergence. 280 questions, 40 categories, four engines, 853 answers | 10.5281/zenodo.21789120 |
Data and analysis code for all three volumes: github.com/Broadcastwell/state-of-geo-2026.
Version 1.0, August 2026.