Chapter 5. One engine is not four
By the end of this chapter you will know how much two AI search engines agree about which vendors belong in an answer, how differently they behave in list length and citation composition, and how often a company's verdict flips depending on which single engine somebody happened to measure.
The claim this chapter defends
Measured, Volume III. Overall mean pairwise vendor-set overlap between engines was 0.313, with a 95% confidence interval of 0.295 to 0.330, over 590 engine-pair observations, and a median of 0.294. Measured, Volume III. Of 32 measured companies tested on at least two engines, 14 were visible on some engines and invisible on others. Reasoned. A visibility score produced on one engine is a measurement of that engine. It is not a measurement of AI search, and for nearly half the companies here it would have produced a materially different verdict if a different engine had been chosen.
Operator disclosure. Broadcastwell ran this measurement and sells services in the category it measures. Broadcastwell is excluded from the measured sample and from every ranking. The mitigation is not that the conflict is absent, it is that the raw data and the code are public and the result can be recomputed by anyone who disagrees.
What was measured
Measured, Volume III. 280 B2B software buyer questions across 40 categories were put to four production AI search engines, ChatGPT, Claude, Perplexity and Google AI Overviews, in a single collection window running 05:28 to 16:29 UTC on 2026-08-04. The set of vendors named in each answer was extracted, and agreement was measured per question. The categories and companies are inherited from Volume I, so results tie back to that single-engine baseline rather than starting from an incomparable frame.
How much two engines share
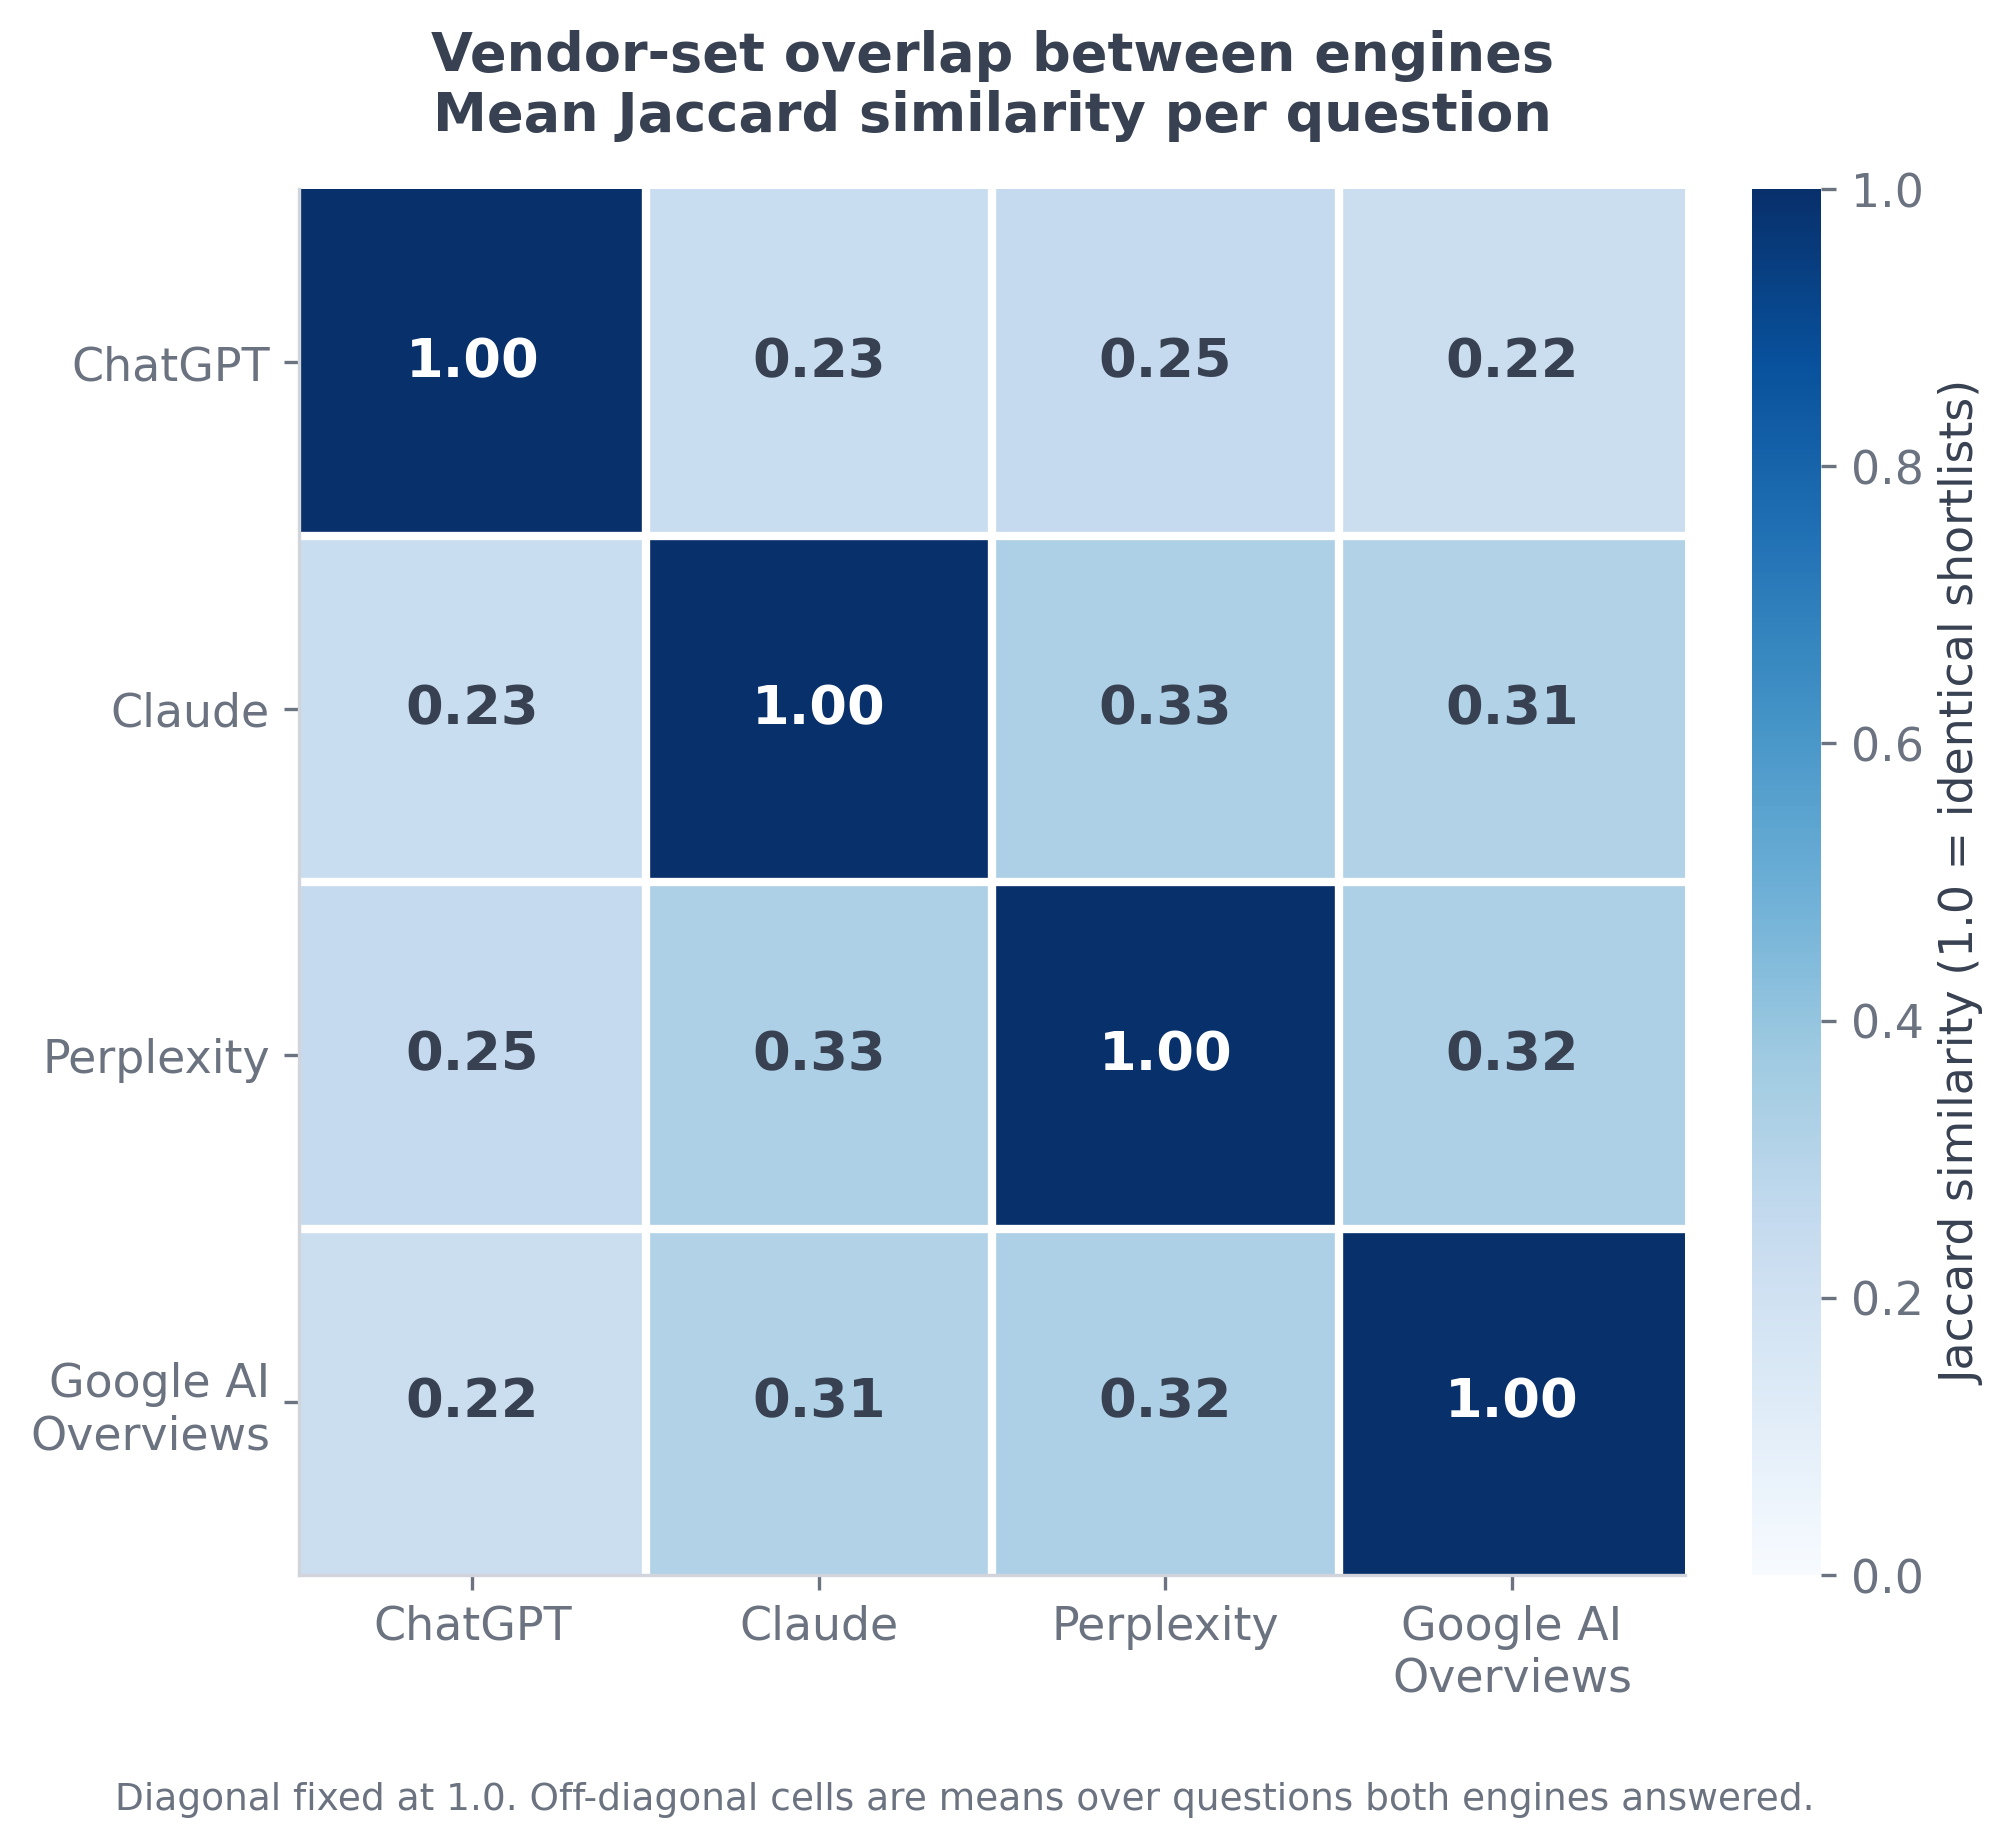
Measured, Volume III. The most alike pair was Claude and Perplexity at 0.327, over 153 questions. The least alike was ChatGPT and Google AI Overviews at 0.223, over 18 questions. Reasoned. Every pair sits closer to a quarter than to a half. Two engines answering the same buyer question mostly name different vendors.
The pair sample sizes are not equal, and that is reported
Measured, Volume III. The Claude and Google AI Overviews pair rests on 247 questions, the Perplexity and Google AI Overviews pair on 136, Claude and Perplexity on 153, and all three pairs involving ChatGPT on 18. Reasoned. Pairs involving the two engines whose collection was cut short carry wide uncertainty and should not be read as precisely as the pairs with two hundred questions behind them. Volume III publishes the sample size next to every pair figure rather than presenting one pooled number, which is the practice this manual asks buyers to demand.
The spread between pairs is itself a finding
Measured, Volume III. The spread between the most and least similar pair was 0.104. Reasoned. So the question "how much do AI engines agree" does not have one answer even inside a single study on a single question set in a single window. Any published figure for cross-engine agreement is a figure for a specific pair, and pairs differ by roughly a third of their own magnitude. A number quoted without its pair is a number that has lost most of its meaning.
Most vendor mentions come from a single engine
Measured, Volume III. Across 142 questions answered by all of Claude, Perplexity and Google AI Overviews, 2,238 distinct vendor mentions were recorded, of which 63.3% came from exactly one engine and 17.5% from all three. Measured, Volume III. The same pattern holds at other set sizes: the single-engine share stayed between 63.3% and 69.8% whichever engines were in the room. Reasoned. A near two-thirds single-engine share is the clearest statement of the chapter's thesis. The candidate sets are substantially engine-specific rather than four views of one underlying ranking.
Engines return very different amounts
Measured, Volume III. Mean vendors named per answer was 4.77 for Google AI Overviews, 8.83 for Claude, 10.69 for Perplexity and 14.72 for ChatGPT. Mean answer length ran from 1,344 characters for Google AI Overviews to 7,627 for ChatGPT. Reasoned. Competing for a slot in a Google AI Overview is competing for a materially scarcer slot than competing inside a conversational answer, before any question of relative merit arises. That alone will make single-engine visibility scores disagree, and it is the reason the divergence analysis in Chapter 6 at /measurement-noise/ has to control for list length.
Agreement depends on which vendors you count
Measured, Volume III. Treating the engines as raters making a binary mention decision, Fleiss kappa across three engines was 0.015 over all vendors and 0.609 when restricted to the study universe. Across two engines it was −0.129 over all vendors and 0.548 restricted. Reasoned. Engines agree reasonably about the well-known vendors in a category and almost not at all about the long tail of names one engine mentions and the others never do. That is precisely the region a challenger brand occupies, which makes the low all-vendor figure the more relevant one for anybody reading this manual.
The sensitivity analysis says the same thing
Measured, Volume III. Recomputed on universe-only vendor sets, mean pairwise overlap rose to 0.506 with a 95% interval of 0.456 to 0.551, against 0.313 on the full sets, and the single-engine share of vendor mentions fell to 41.7% from 67.3%. Reasoned. Both readings are correct and they answer different questions. If you want to know whether engines agree about the established players, the restricted figure is the one. If you want to know whether they agree about who exists in a category at all, the full-set figure is the one, and it is much lower.
How much of each engine is unique to it
Measured, Volume III. Across the three-engine set, 40.6% of Claude's vendor slots were unique to Claude, 49.6% of Perplexity's were unique to Perplexity, and 23.2% of Google AI Overviews' were unique to it. Across the two-engine set, 64.1% of Claude's slots were unique against Google AI Overviews' 34.7%. Reasoned. The engine returning the longest lists contributes the most names nobody else names, and the engine returning the shortest lists contributes the fewest. Uniqueness is therefore partly a property of list length rather than of independent judgement, which is a caution to carry into any claim that one engine "finds" vendors others miss.
What a blended multi-engine score hides
Reasoned. Averaging across engines produces a number that no engine would have produced, and it hides the case that matters most. A company saturated on one engine and absent on another can blend to the same mid-range score as a company that is mediocre everywhere, and those two companies need completely different work. Given that 14 of 32 companies here were visible on some engines and invisible on others, a blend is not a summary of the situation for nearly half the sample. It is a description of a company that does not exist.
The company-level result is the commercial one
Measured, Volume III. Of 32 measured companies with questions in their category, all 32 were tested on at least two engines. 14 were visible on some engines and invisible on others, 18 were named at least once by every engine that answered for them, and none were named by no engine at all. Reasoned. 14 of 32 is not an edge case. For those companies the answer to "are we visible in AI search" is genuinely engine-dependent, and a single-engine report would deliver a confident verdict that a different single-engine report would contradict.
The tie back to the single-engine baseline
Measured, Volume III. Against the Volume I single-engine baseline, the correlation across 32 companies was Pearson r = 0.70, joined at category level because Volume I published company-level results anonymised. Volume III states that a category-level join is weaker than a per-company join. Reasoned. A correlation of 0.70 means the single-engine baseline carried real signal about multi-engine visibility and was far from a complete description of it. Substantial but incomplete is consistent with the 14 of 32 result rather than in tension with it.
Citation behaviour differs at least as much as naming
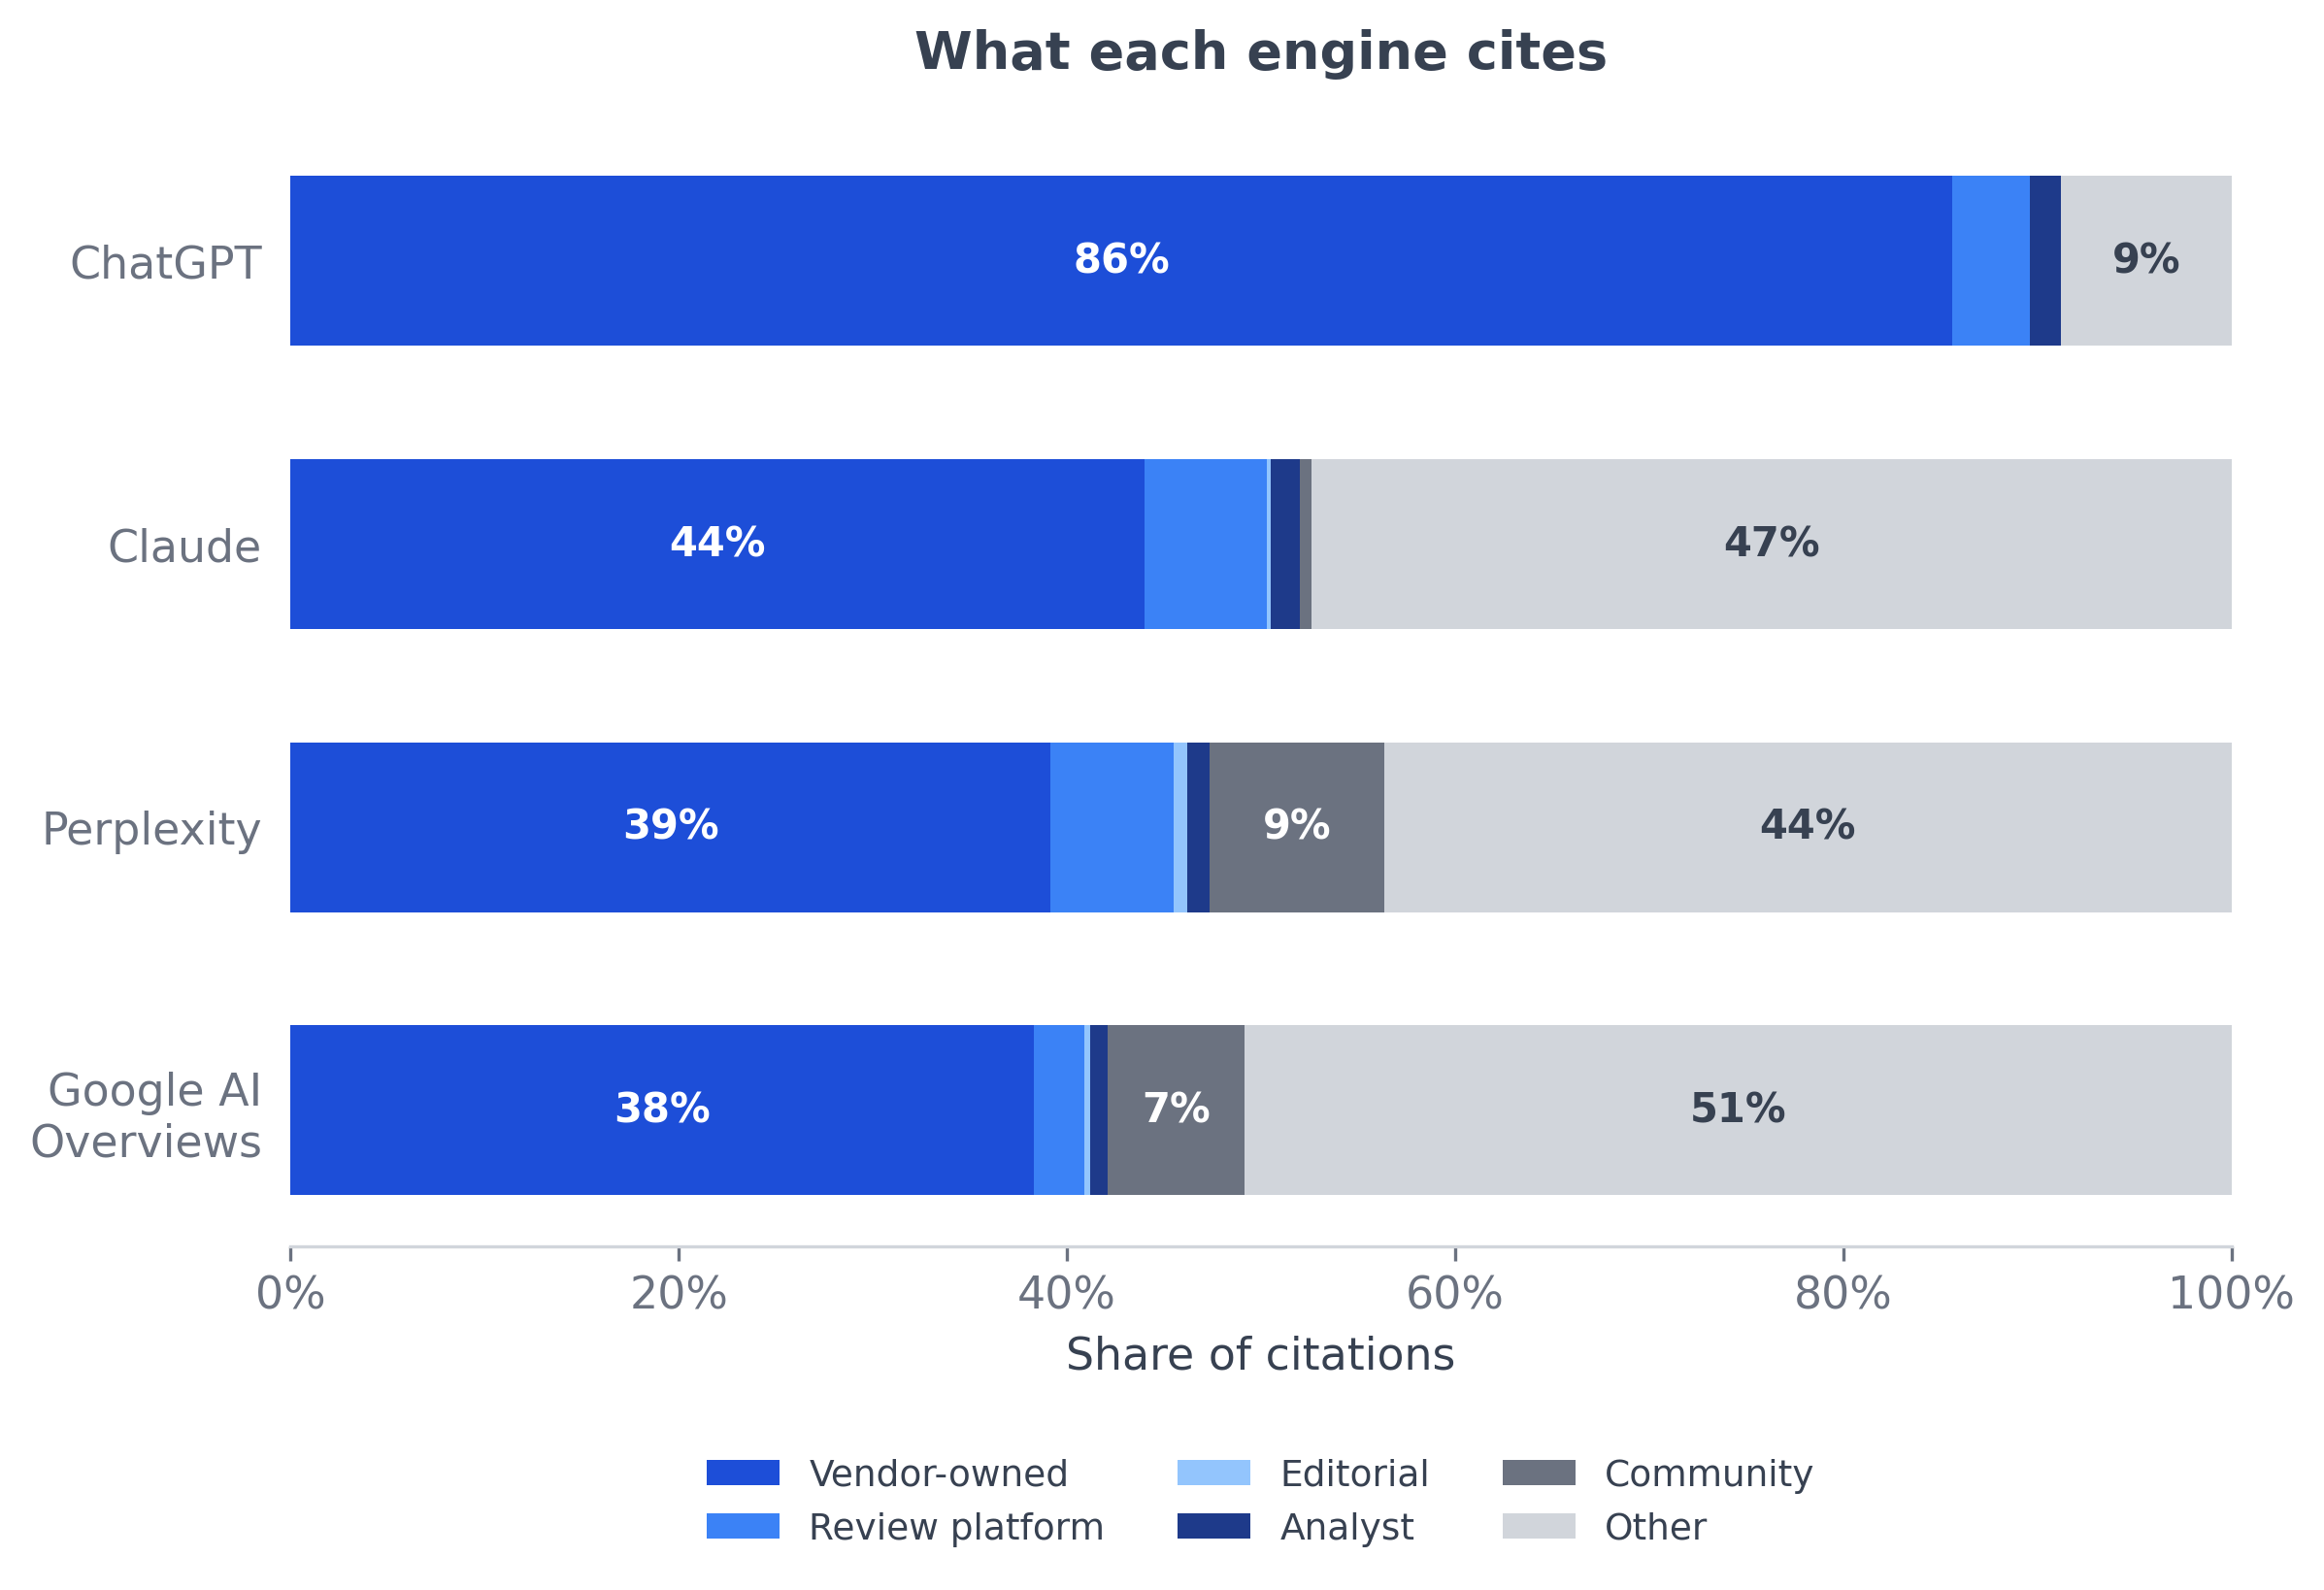
Measured, Volume III. Vendor-owned share of citations was 85.6% on ChatGPT over 125 citations, 44.0% on Claude over 3,563, 39.2% on Perplexity over 3,016 and 38.3% on Google AI Overviews over 2,849. Community sources ran from 0.0% on ChatGPT to 9.0% on Perplexity. Reasoned. The composition of the evidence layer is engine-specific too, so a citation-mix statistic from one engine does not transfer either. Chapter 4 at /who-gets-cited/ reports the single-engine composition that this table splits apart.
Citations per answer differ by a factor of three
Measured, Volume III. Mean citations per answer were 6.9 for ChatGPT, 12.7 for Claude, 19.2 for Perplexity and 11.0 for Google AI Overviews. Reasoned. An engine that cites nineteen sources per answer is reaching into a materially different part of the evidence layer than one citing seven. That is another axis on which a single-engine measurement fails to generalise, and it means being present in the sources one engine favours is no guarantee of being present in the sources another one reaches for.
Where independent work lands
Reported. Jack, Lehman, Maloney and Xu compute per-prompt cross-provider overlap of recommended brand sets over commercially framed prompts and report roughly 0.35, in work covering two providers as model pools rather than production search products, with no Google surface and no released dataset (arXiv:2606.26116). Measured, Volume III. This study's overall pairwise figure is 0.313. Reasoned. Two independent measurements on different systems and different corpora landing in the same band is weak but real corroboration that the low agreement is a property of the systems rather than an artefact of one instrument.
Limitation: the collection was interrupted
Measured, Volume III. Three of the four API accounts ran out of credit during collection. One was topped up and finished, two were not. The study as executed holds 18 ChatGPT, 280 Claude, 175 Perplexity and 280 Google AI Overviews answers, against 280 planned for each. Reasoned. Every ChatGPT pair therefore rests on 18 questions and carries wide uncertainty, and the four-engine intersection is reported at its true size rather than dressed up. Volume III's answer counts do not reconcile across the different tables it publishes, which is recorded as an open flag in this manual and not reconciled here.
Limitation: one window, and endpoints rather than apps
Measured, Volume III. Everything was collected between 05:28 and 16:29 UTC on 2026-08-04, and the engines are production endpoints rather than the consumer applications people type into. Google AI Overviews has no official API and is collected by scraping. Reasoned. Results describe what these endpoints returned in that window. The retrieval layer, system prompt and ranking logic of the consumer products are not observable from outside, and this manual does not claim otherwise.
What this chapter does not claim
Reasoned. It does not claim any engine is better, more accurate or more commercially valuable than another. It does not claim the four engines have equal buyer share, because nothing here observes buyers. It does not claim the divergence figures would replicate on a different question set or in a different month. And it does not claim that measuring four engines is always necessary, only that a claim about AI search made from one engine is a claim the evidence does not support.
What this means for your buying decision
Reasoned. Ask which engines a score covers and refuse to accept "AI search" as an answer. Ask for the per-engine breakdown rather than a blend, because a blend can hide a company that is saturated on one engine and absent on another. If a supplier measures one engine, ask them to say so on the front of the report rather than in a footnote, and price the work accordingly. Chapter 12 at /how-to-buy-geo/ sets out the full question list.
Where to go next
Reasoned. Chapter 6 at /measurement-noise/ asks whether the divergence measured here is larger than each engine's own run-to-run variance, which is the test that decides how much of this chapter is signal. Chapter 7 at /overview-trigger-rate/ covers the questions on which one of these engines returns no answer at all. Chapter 8 at /valid-measurement/ turns all of it into criteria a measurement has to meet.
Sources
Every figure in this chapter comes from The 2026 State of GEO, Volume III: the pairwise overlap matrix and its sample sizes, the 0.313 overall mean and its interval, the consensus shares, the per-engine vendor counts and answer lengths, the Fleiss kappa values, the universe-only sensitivity analysis, the company-level 14 of 32 result, the correlation against the Volume I baseline, and the per-engine citation table. External work is cited by author and identifier and is reproduced from Volume III's reference list. Data and code are at github.com/Broadcastwell/state-of-geo-2026 under volume-iii/.
About this manual
Author. Sairam Sivakumar, Broadcastwell.
Operator disclosure. Broadcastwell ran this measurement and sells services in the category it measures. Broadcastwell is excluded from the measured sample and from every ranking. The mitigation is not that the conflict is absent, it is that the raw data and the code are public and the result can be recomputed by anyone who disagrees.
Historical research record. The dated collection designs and source files remain available in the published research repository and the three volumes linked below. The July 2026 collection used four engines and five runs per question; the 18 August 2026 collection used the same ten questions and four engines, with one run per question.
Reading dated measurements. Reasoned. Compare like with like. A change in the number of runs changes the evidence base, even when the questions and engines are unchanged. Keep the collection date, question wording, engine, run count and exclusions beside any result. Inspect the retained answers and sources before interpreting a difference as movement. Naming and citation answer different questions, so report them separately. A dated observation supports a claim about that collection; it does not establish a current result or prove that an intervention caused a change.
Not peer reviewed. This is an independent industry study published as an open dataset with the analysis code that produced every figure in it. It has not been through academic peer review. Read it as measurement, and check the measurement. If you disagree with a number here, recompute it from the public data and publish what you get.
Licence. Prose and figures CC BY 4.0. Site code MIT.
The three volumes.
| Volume | What it covers | DOI |
|---|---|---|
| Volume I | 85 companies, 61 categories, 860 scored answers and 5,160 citations, one engine held constant. The dataset README additionally records 1,753 unique domains cited | 10.5281/zenodo.21537014 |
| Volume II | The Absence Ladder. All 616 absence records classified by question shape | 10.5281/zenodo.21586091 |
| Volume III | Cross-engine divergence. 280 questions, 40 categories, four engines, 853 answers | 10.5281/zenodo.21789120 |
Data and analysis code for all three volumes: github.com/Broadcastwell/state-of-geo-2026.
Version 1.0, August 2026.