Chapter 7. The AI Overview does not always appear
By the end of this chapter you will know how often one major engine declined to generate an answer at all, how much that rate moved with the shape of the question, and why a visibility percentage is meaningless until you know which of two denominators it used.
The claim this chapter defends
Measured, Volume III. Google returned an AI Overview for 92.1% of these buyer questions, 258 of 280. On the remaining 22 there was no AI answer to be visible in at all. Measured, Volume III. The rate moved with question shape, from 88.8% on best-of questions to 100% on comparison questions. Reasoned. A score computed over the answers that appeared is not the same quantity as a score computed over the questions asked, and the gap between the two is set by a trigger rate that the vendor being measured does not control.
Operator disclosure. Broadcastwell ran this measurement and sells services in the category it measures. Broadcastwell is excluded from the measured sample and from every ranking. The mitigation is not that the conflict is absent, it is that the raw data and the code are public and the result can be recomputed by anyone who disagrees.
Two different reasons an answer can be missing
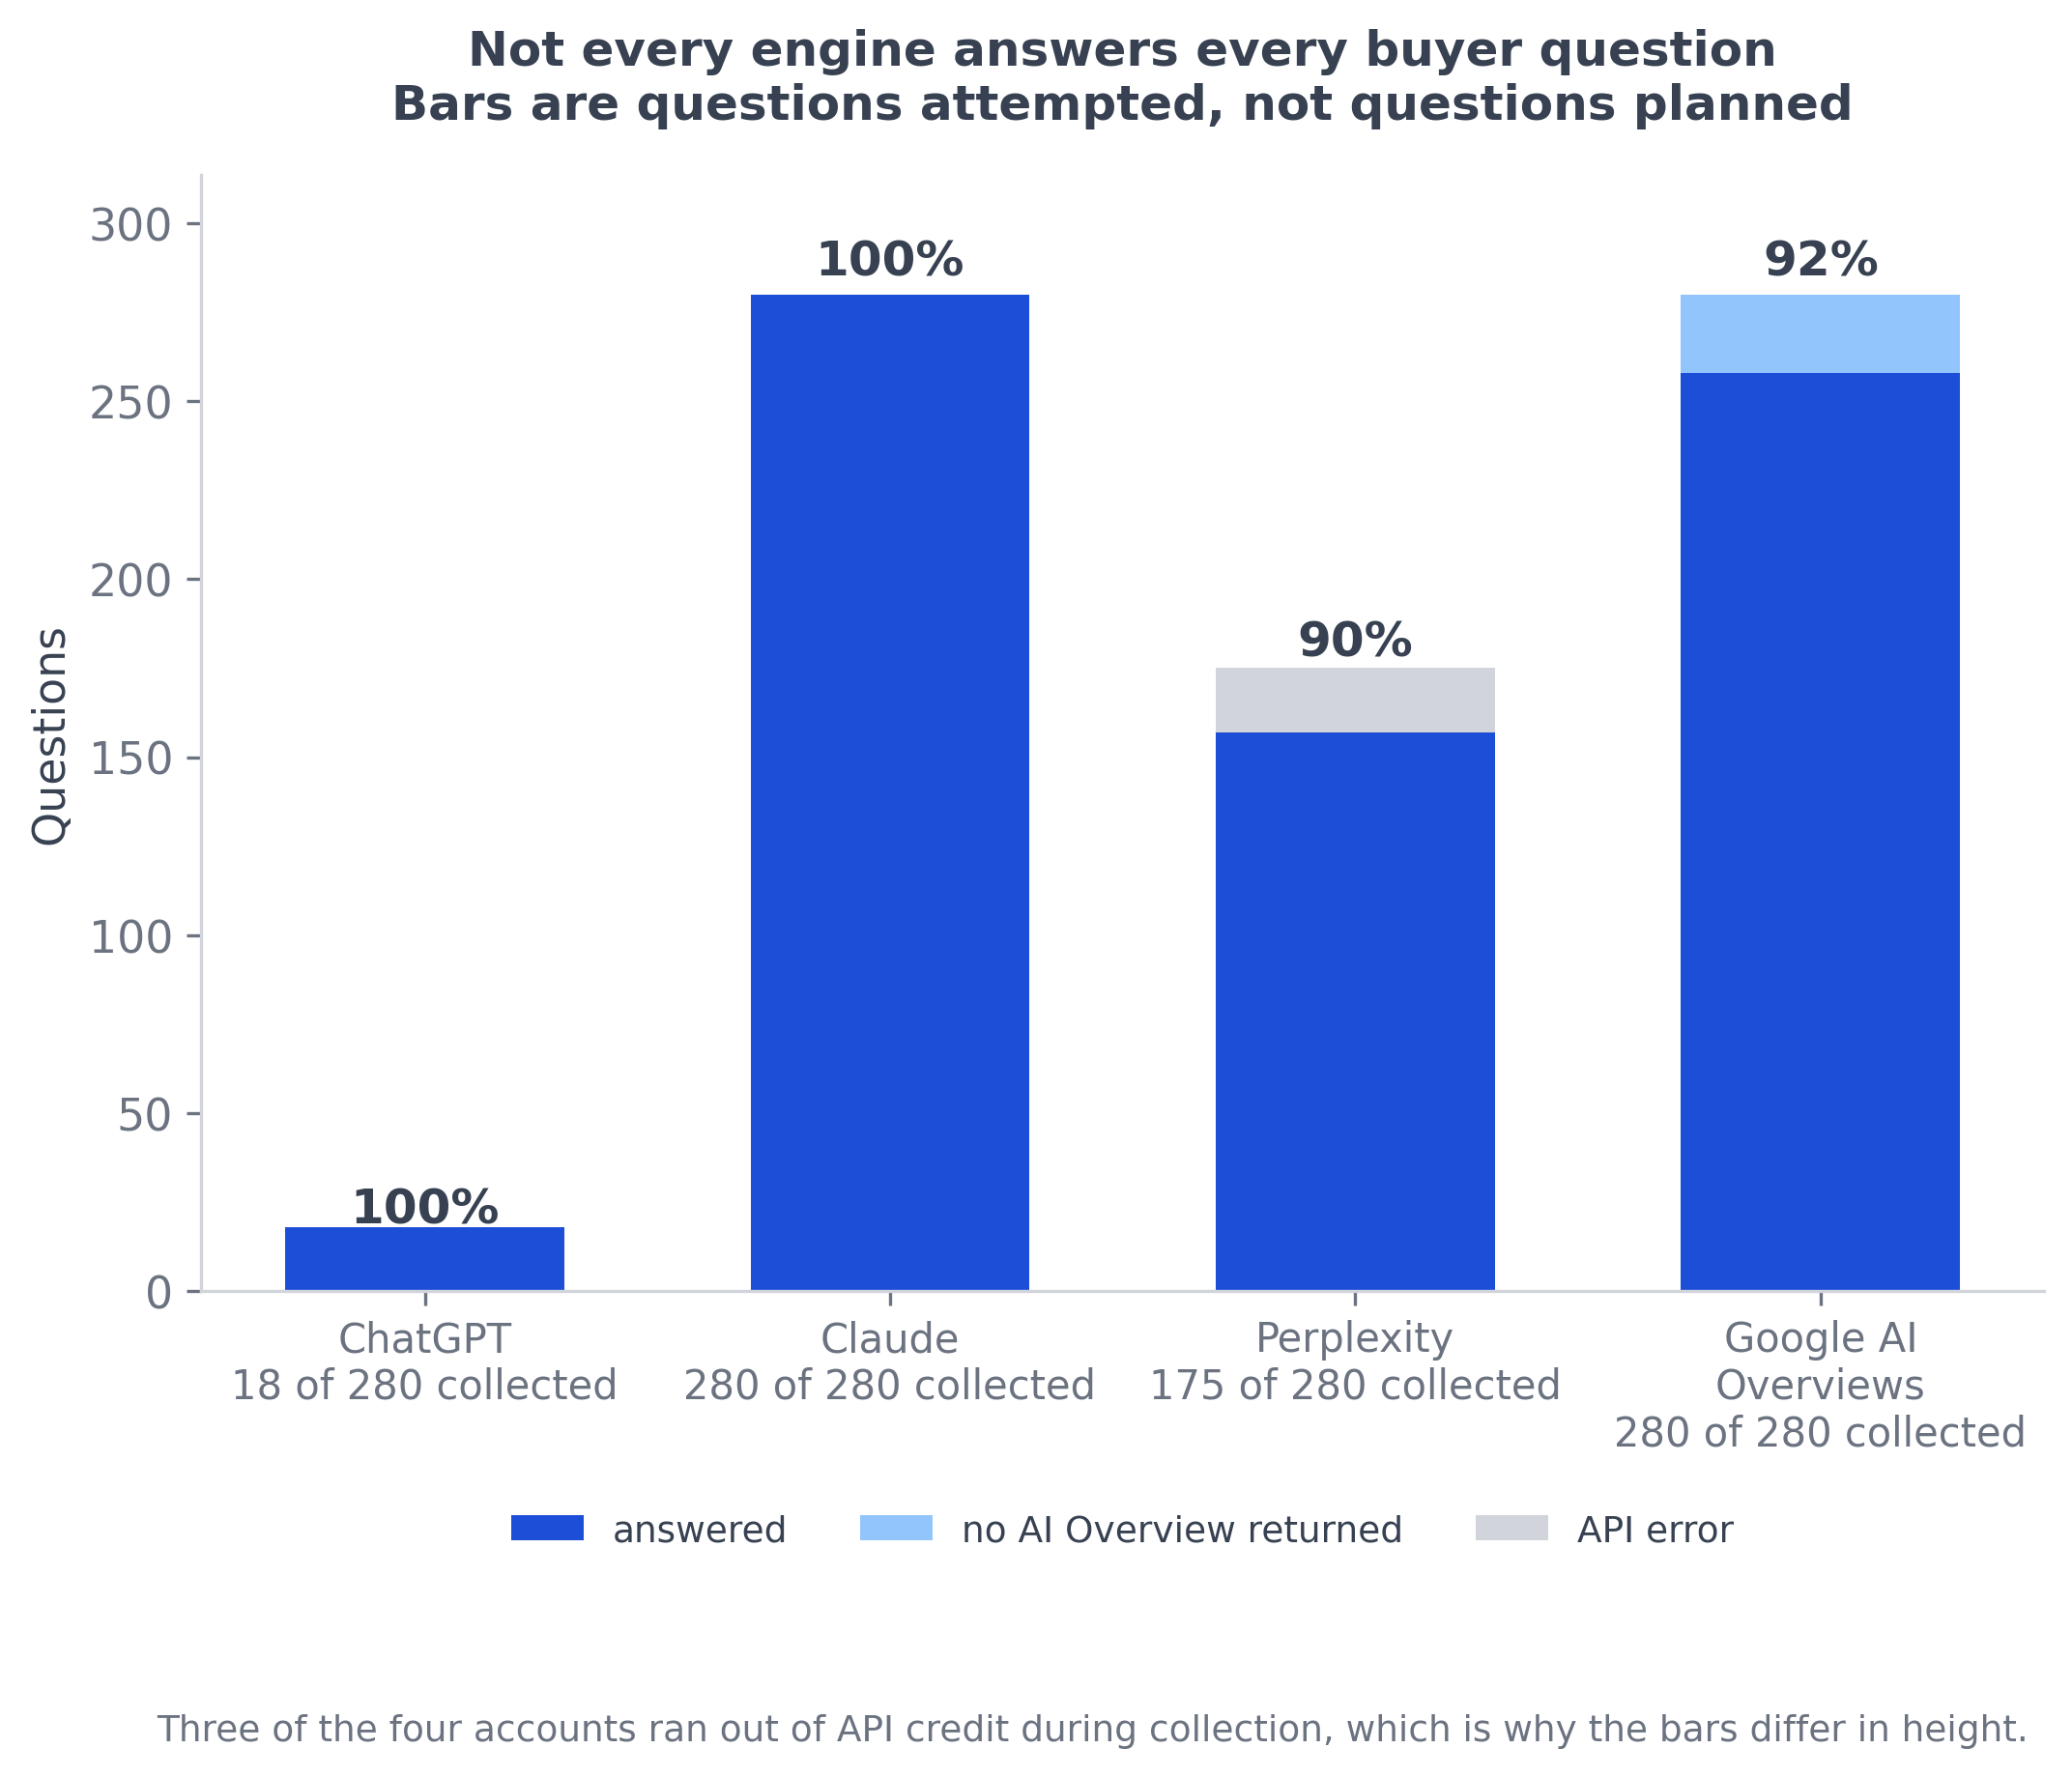
Measured, Volume III. Volume III records a Google query that returns no AI Overview under its own status, no_aio, separately from an API error. Reasoned. The distinction is load bearing. An error is a fault in the measurement. A declined answer is a result about the engine, and treating the two the same way corrupts both the numerator and the denominator of anything computed downstream.
The trigger rate is a property of the question, not the vendor
Measured, Volume III. By question shape, an AI Overview was returned for 72 of 80 alternatives questions at 90.0%, 71 of 80 best-of questions at 88.8%, 47 of 47 comparison questions at 100%, 34 of 38 evaluation questions at 89.5%, and 32 of 33 use-case questions at 97.0%. Reasoned. Comparison questions triggered an overview every single time. Best-of questions, the shape most people picture when they imagine an AI shortlist, triggered least often. No vendor influenced any of that, and yet it determines how many chances that vendor had to appear.
The worked illustration, using only published counts
Measured, Volume III. Of 80 best-of questions, 71 returned an AI Overview. Reasoned. So a vendor measured on best-of questions has the questions that returned no answer silently removed if the measurement counts only the answers that appeared. Its score is then a fraction of 71 rather than of 80. On comparison questions no such removal happens, because all 47 returned an answer. The identical vendor, measured on two shapes with the same underlying performance, will show a different score purely because the two shapes lose different numbers of questions from the denominator.
Which denominator is right depends on the question you are asking
Reasoned. Both denominators are defensible and they answer different things. Over answers that appeared, the figure tells you how well the vendor competes when there is an answer to compete in. Over questions asked, it tells you how often a buyer asking that question sees the vendor at all. The second is closer to the commercial reality and it is the smaller number, which is why suppliers reporting a single figure have an incentive toward the first. Volume III states the failure mode plainly: a score that silently drops those questions from its denominator will overstate coverage.
The shape mix of a question bank becomes a lever
Reasoned. Because trigger rates differ by shape and this manual's own bank contains several shapes, the composition of the bank changes the headline trigger rate and therefore the size of the denominator effect. A bank weighted toward comparison questions will show a higher trigger rate and a smaller gap between the two denominators than one weighted toward best-of. That makes the shape mix a disclosure requirement rather than an implementation detail, and Appendix A at /question-bank/ sets out what a bank has to declare.
The other engines answered everything they attempted
Measured, Volume III. ChatGPT answered 18 of 18 attempted and Claude 280 of 280, both at 100%. Perplexity answered 157 of the questions it attempted, at an answer rate of 89.7%. Reasoned. Only the Google surface declined to generate. The conversational engines answered whenever they were reachable, so the trigger-rate problem in this dataset is specific to the AI Overview surface rather than general to AI search. A measurement covering only conversational engines will not encounter it, and a measurement including Google will.
Where the collection shortfall sits, and what it is not
Measured, Volume III. Three of the four API accounts ran out of credit during collection, which is why the attempted counts differ between engines. Rows carrying a billing error are excluded from every denominator and retained in the raw data with an error status. Reasoned. That is a fault in the measurement and Volume III separates it from the no_aio result, which is a fact about the engine. This manual records Volume III's differing answer counts as an open flag and quotes whichever figure belongs to the claim being made without asserting any relation between them.
What the wider literature reports, and how it compares
Reported. Seer Interactive reports AI answer trigger rates of 95.4% for comparison queries over 280 queries and 85.9% for question-format queries over 1,413, published April 2026 on data running to February 2026. Measured, Volume III. This study's 92.1% sits below Seer's general-population rates. Reasoned. That is the direction you would expect: narrow B2B software buying questions are not consumer queries, and a narrower intent seems to trigger an overview less reliably. Two independent measurements finding comparison questions at or near the top of the trigger ordering is a small piece of mutual corroboration.
The rate is moving, which makes the date part of the figure
Reported. Semrush reports that the share of commercial search results carrying an AI Overview grew 71 percent between November 2025 and April 2026, published 2 July 2026. Reasoned. A trigger rate measured in one month is therefore not a constant to be reused later. Any visibility score whose denominator depends on the trigger rate inherits that drift, so two scores computed months apart are not comparable even if the question set, the engine and the vendor are all identical. This is a second reason, on top of run-to-run variance, that a score without a date is not a score.
Trigger rate compounds with slot scarcity
Measured, Volume III. Google AI Overviews returned an answer on 258 of 280 questions and named a mean of 4.77 vendors when it did, the smallest set of the four engines. Reasoned. Two structural constraints therefore stack on the same surface: on 22 questions there was no answer to be in, and on the rest there were fewer places in it than any other engine offered. Neither constraint is about the vendor. Both reduce the number of opportunities before merit is considered, and a score that reports only the outcome attributes the whole of that reduction to the vendor's performance.
What this does to a trend line
Reasoned. If the denominator can move between measurements, a visibility trend can rise or fall without the numerator changing at all. A vendor named in the same absolute number of answers will show a higher percentage in a month when fewer questions triggered an answer, because the denominator shrank underneath it. Anybody presenting a month-on-month visibility chart therefore owes you the denominator for each point on it, and a chart with a single series and no denominators cannot be read as improvement or decline.
The surface is not the whole page
Reasoned. On a question where no AI Overview appears, the buyer still sees a results page and still finds vendors on it. The absence of an overview is not the absence of an outcome, it is the absence of the specific surface being measured. This matters for how a score should be described: it is a measurement of presence in one generated surface, not a measurement of whether a buyer researching that question encounters the vendor. Conflating the two overstates what AI visibility work can be expected to do.
Coverage and performance are different quantities
Reasoned. Splitting the two makes both readable. Coverage is the share of your questions on which an answer exists at all. Performance is the share of the existing answers that name you. A vendor with strong performance and weak coverage has a different problem from one with the reverse, and the combined percentage cannot distinguish them. Reporting the pair costs nothing beyond keeping the no_aio count, which any measurement already has if it bothered to record it.
What a buyer should be able to see
Reasoned. Three counts, published together: questions asked, answers returned, and questions on which the vendor was named. Everything else in a visibility report can be derived from those three, and no report that omits the middle one can be checked. If a supplier cannot supply the second count, they either did not record whether an answer appeared or are computing over a denominator they have not disclosed, and the two are indistinguishable from outside.
Limitation: one surface, one window, scraped collection
Measured, Volume III. The trigger figures cover one engine's surface, collected between 05:28 and 16:29 UTC on 2026-08-04, and Google AI Overviews has no official API so it is collected by scraping. A no_aio result means the collection returned no overview, which the study treats as Google not producing one. Reasoned. That treatment is reasonable and not directly verifiable from outside, so the trigger rate carries an unmeasured dependency on the collection path. Volume III says so, and a reader should discount accordingly rather than treating 92.1% as an exact property of the engine.
Limitation: the shape counts are small in places
Measured, Volume III. The shape breakdown rests on 80 alternatives questions, 80 best-of, 47 comparison, 38 evaluation, 33 use-case and 2 other. Reasoned. The comparison result of 47 out of 47 is a clean 100% on a sample of 47, which is enough to say comparison questions triggered reliably and not enough to say they always will. The evaluation and use-case cells are smaller again. Read the ordering of the shapes as the finding and the individual decimals as indicative.
Why this is the easiest of the four disclosures to demand
Reasoned. Of everything this manual asks a buyer to require, the answered count is the cheapest to supply. Recording whether an answer came back costs nothing at collection time, needs no extra calls, and is already in any raw log worth keeping. A supplier who cannot produce it has either discarded it deliberately or never captured it, and both are informative about the rest of the measurement. Treat the answered count as a competence test rather than as a favour you are asking for.
What this chapter does not claim
Reasoned. It does not claim to know why Google declines to generate on some questions, because nothing here observes the decision. It does not claim the 22 questions share any property beyond the shape breakdown reported. It does not claim other engines will develop the same behaviour. And it does not claim that a missing overview means no AI presence for the buyer, because the same buyer may ask the same question elsewhere and Chapter 5 at /engine-divergence/ shows how different the answer can be.
What this means for your buying decision
Reasoned. Ask for three counts rather than one percentage: questions asked, answers returned, and answers naming you. Ask which denominator the headline figure uses and require it in writing, because the two differ by however many questions returned no answer. If a supplier cannot tell you how many of your questions produced no AI answer at all, they cannot tell you what their percentage is a percentage of. Chapter 12 at /how-to-buy-geo/ has the full list of questions to ask.
Where to go next
Reasoned. Chapter 8 at /valid-measurement/ turns the denominator requirement into one criterion among several that a measurement has to meet. Chapter 6 at /measurement-noise/ covers the other reason a single figure moves without the vendor changing. Appendix A at /question-bank/ sets out the question shapes whose mix determines the trigger rate in the first place.
Sources
Every figure in this chapter comes from The 2026 State of GEO, Volume III: the 92.1% trigger rate and its 258 of 280 base, the per-shape breakdown, the per-engine attempted and answered counts, the separation of no_aio from API error, and the collection window. External trigger-rate figures are attributed to Seer Interactive and Semrush with their publication dates and are reproduced from Volume III's reference list. Data and code are at github.com/Broadcastwell/state-of-geo-2026 under volume-iii/.
About this manual
Author. Sairam Sivakumar, Broadcastwell.
Operator disclosure. Broadcastwell ran this measurement and sells services in the category it measures. Broadcastwell is excluded from the measured sample and from every ranking. The mitigation is not that the conflict is absent, it is that the raw data and the code are public and the result can be recomputed by anyone who disagrees.
Historical research record. The dated collection designs and source files remain available in the published research repository and the three volumes linked below. The July 2026 collection used four engines and five runs per question; the 18 August 2026 collection used the same ten questions and four engines, with one run per question.
Reading dated measurements. Reasoned. Compare like with like. A change in the number of runs changes the evidence base, even when the questions and engines are unchanged. Keep the collection date, question wording, engine, run count and exclusions beside any result. Inspect the retained answers and sources before interpreting a difference as movement. Naming and citation answer different questions, so report them separately. A dated observation supports a claim about that collection; it does not establish a current result or prove that an intervention caused a change.
Not peer reviewed. This is an independent industry study published as an open dataset with the analysis code that produced every figure in it. It has not been through academic peer review. Read it as measurement, and check the measurement. If you disagree with a number here, recompute it from the public data and publish what you get.
Licence. Prose and figures CC BY 4.0. Site code MIT.
The three volumes.
| Volume | What it covers | DOI |
|---|---|---|
| Volume I | 85 companies, 61 categories, 860 scored answers and 5,160 citations, one engine held constant. The dataset README additionally records 1,753 unique domains cited | 10.5281/zenodo.21537014 |
| Volume II | The Absence Ladder. All 616 absence records classified by question shape | 10.5281/zenodo.21586091 |
| Volume III | Cross-engine divergence. 280 questions, 40 categories, four engines, 853 answers | 10.5281/zenodo.21789120 |
Data and analysis code for all three volumes: github.com/Broadcastwell/state-of-geo-2026.
Version 1.0, August 2026.