Chapter 6. Your Score Is Noisier Than Your Vendor Admits
The claim this chapter defends
Measured, Volume III. Asked the identical buyer question three times inside one collection window, an AI search engine agrees with roughly half of its own previous shortlist: mean vendor-set agreement of 0.499 for Google AI Overviews across 62 repeat pairs and 0.442 for Claude across 74 repeat pairs, on a stratified subsample of 25 questions. Reasoned. Every single-run visibility number sold in this industry carries that variance and cannot show it. Any measured difference between two engines contains an unknown amount of the same variation, so a divergence headline reported without a noise floor measured on the same questions in the same window is not interpretable.
Operator disclosure. Broadcastwell ran this measurement and sells services in the category it measures. Broadcastwell is excluded from the measured sample and from every ranking. The mitigation is not that the conflict is absent, it is that the raw data and the code are public and the result can be recomputed by anyone who disagrees.
These systems are not deterministic
Reasoned. Ask the same engine the same question twice and the shortlist moves. This is not a defect, it is how the products work: retrieval is live, ranking is probabilistic, and the answer is generated rather than looked up. The consequence for measurement is severe and mostly unstated. Any measured difference between two engines therefore contains an unknown amount of the same variation you would get by asking one engine twice. Unless the noise floor is measured on the same questions in the same window, a divergence headline is not a finding about engines. It is a number with an unstated denominator.
What was measured
Measured, Volume III. 280 B2B software buyer questions across 40 categories, put to four production AI search engines: ChatGPT, Claude, Perplexity and Google AI Overviews. Collection ran in a single window, 05:28 to 16:29 UTC on 2026-08-04. From each answer the study extracted the set of vendors named, then measured how much two vendor sets overlapped. The categories and companies are inherited from Volume I, so the results tie back to that single-engine baseline rather than starting from a fresh and incomparable frame.
The repeat subsample is the whole design
Measured, Volume III. A stratified subsample of 25 questions, spread across the 40 categories and balanced across question shapes, was run three times on all four engines. Reasoned. That subsample is what makes the rest of the study readable. Between-engine agreement is compared against within-engine agreement on exactly those questions, on the same scale, from the same window, measured by the same instrument. Without it there is no way to tell a real engine difference from ordinary nondeterminism, and every cross-engine comparison published without one has that problem whether or not it says so.
What went wrong during collection, stated plainly
Measured, Volume III. Three of the four API accounts ran out of credit during collection. One was topped up and finished. Two were not. The study as executed therefore holds 18 ChatGPT, 280 Claude, 175 Perplexity and 280 Google AI Overviews answers, against 280 planned for each. Rows carrying a billing error are excluded from every denominator in the paper and are retained in the raw data with an error status, so the exclusion is checkable by anyone who wants to check it rather than taken on trust.
Why that disclosure is a feature and not an embarrassment
Measured, Volume III. The two engines that did not finish were deliberately not refilled. A refill collected in a second window would make every cross-engine pair span two windows, so engine drift between windows would read as engine divergence and inflate the exact quantity the study measures. Staying short was the more honest option. The four-engine intersection is reported at its true size of 18 questions rather than dressed up, and every figure carries the sample it was computed on. Reasoned. This disclosure is the reason the chapter can be trusted, not a caveat on it.
The decisive test, reported per engine and never pooled
Measured, Volume III. For each engine the comparison is like for like on the same 25 stability questions. Within is every pair of repeats of the same question on that engine. Between is that same engine against the others on the first run of those same questions. An engine needs at least 12 repeat pairs before a verdict is asserted for it.
| Engine | Repeat pairs | Within-engine | Between-engine | Gap (95% CI) |
|---|---|---|---|---|
| Claude | 74 | 0.442 (0.389 to 0.494) | 0.277 (0.222 to 0.333), n = 37 | 0.165 (0.082 to 0.242) |
| Google AI Overviews | 62 | 0.499 (0.441 to 0.556) | 0.240 (0.186 to 0.295), n = 35 | 0.258 (0.178 to 0.338) |
Measured, Volume III. ChatGPT and Perplexity contributed no repeat pairs and therefore no verdict. That is stated rather than hidden.
Engines name very different numbers of vendors
| Engine | Mean vendors named per answer |
|---|---|
| Google AI Overviews | 4.77 |
| Claude | 8.83 |
| Perplexity | 10.69 |
| ChatGPT | 14.72 |
Reasoned. That spread is not a curiosity. It is a threat to the headline. Set-overlap between two similar-length lists runs mechanically higher than between two lists of very different length, so part of any within-versus-between gap could be list length rather than divergence.
The asymmetry that has to be controlled
Reasoned. Within-engine pairs compare an engine with itself, so they are length-matched by construction: the same engine returns roughly the same number of vendors on every run. Between-engine pairs are not length-matched at all, because they compare an engine that names five vendors against one that names nine or fifteen. That asymmetry systematically depresses the between-engine figure for reasons that have nothing to do with which vendors the engines picked. Left uncontrolled, it would manufacture a gap out of arithmetic. This is the chapter's methodological spine.
Three controls, each recomputed from the same pairs
Measured, Volume III. First, restrict both vendor sets to the study universe, which removes every out-of-universe name and narrows the length spread. Second, truncate each answer to its first five named vendors, which forces both sides of every comparison to the same maximum length. Third, replace the overlap measure with a coefficient normalised by the smaller of the two sets, which is the least forgiving of a length artefact because it cannot be depressed by one side simply being longer. All three are recomputed from the same repeat pairs, not from a fresh sample.
The split result, reported honestly because it is the point
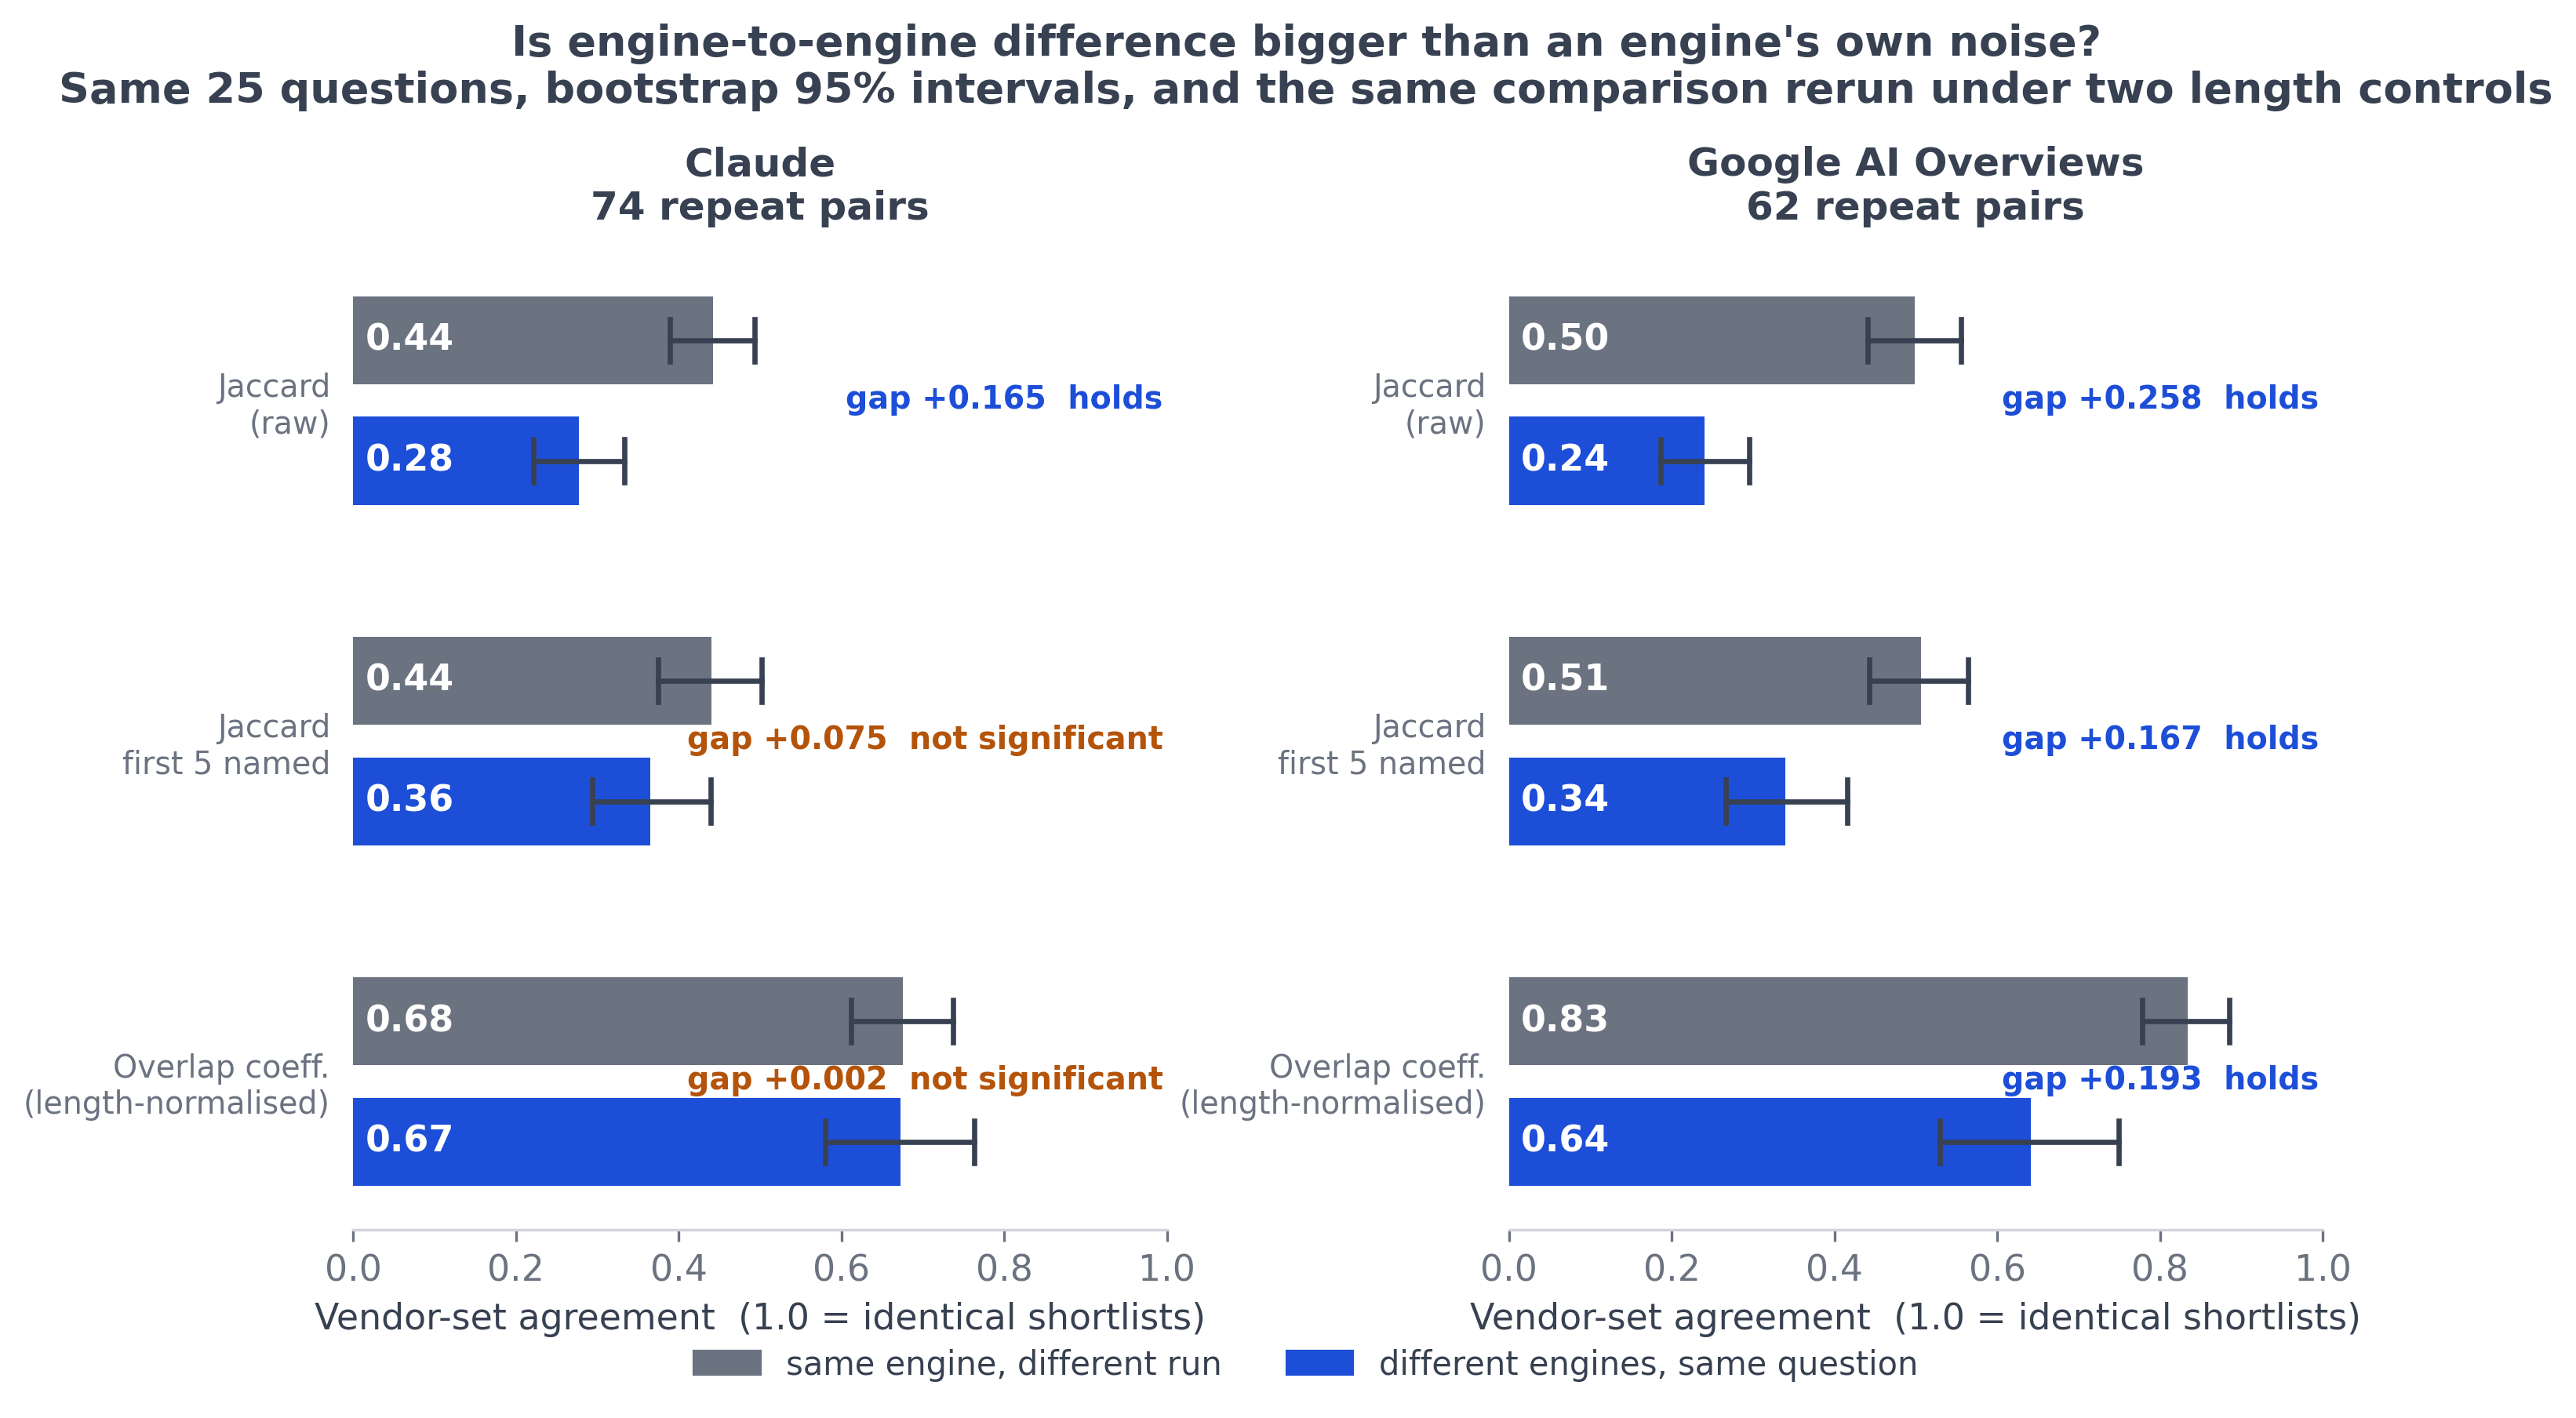
Measured, Volume III. On Google AI Overviews the gap survives all three controls. On Claude it does not.
The full robustness table
| Engine | Measure | Within | Between | Gap (95% CI) | Separates |
|---|---|---|---|---|---|
| Claude | Jaccard, full vendor sets | 0.442 (n=74) | 0.277 (n=37) | 0.165 (0.082 to 0.242) | yes |
| Claude | Jaccard, restricted to the study universe | 0.648 (n=44) | 0.458 (n=24) | 0.189 (−0.030 to 0.403) | no |
| Claude | Jaccard, truncated to the first 5 named vendors | 0.440 (n=74) | 0.365 (n=37) | 0.075 (−0.014 to 0.177) | no |
| Claude | Overlap coefficient, normalised by the smaller set | 0.675 (n=70) | 0.673 (n=33) | 0.002 (−0.112 to 0.113) | no |
| Google AI Overviews | Jaccard, full vendor sets | 0.499 (n=62) | 0.240 (n=35) | 0.258 (0.178 to 0.338) | yes |
| Google AI Overviews | Jaccard, restricted to the study universe | 0.625 (n=20) | 0.300 (n=20) | 0.325 (0.050 to 0.575) | yes |
| Google AI Overviews | Jaccard, truncated to the first 5 named vendors | 0.507 (n=62) | 0.340 (n=35) | 0.167 (0.066 to 0.262) | yes |
| Google AI Overviews | Overlap coefficient, normalised by the smaller set | 0.834 (n=58) | 0.641 (n=32) | 0.193 (0.075 to 0.317) | yes |
What the Claude column means
Measured, Volume III. The raw gap of 0.165 falls to 0.075 with a confidence interval of −0.014 to 0.177 under truncation, and to 0.002 with an interval of −0.112 to 0.113 under the overlap coefficient. Both intervals include zero. Reasoned. On Claude, what looks like cross-engine divergence cannot be distinguished from the fact that the engines being compared name lists of different lengths. That is the finding, not the finding the study set out to get, and it is reported because the controls were specified in advance rather than chosen after seeing which ones were flattering.
What the Google AI Overviews column means
Measured, Volume III. For Google AI Overviews the gap stays positive at 95% under every control, including the overlap coefficient, which normalises by the smaller of the two sets and is the hardest of the three to fool. Reasoned. The separation there is not length. It is a real difference between what Google AI Overviews returns and what the other engines return, larger than Google AI Overviews' own run-to-run noise on the same questions in the same window. Divergence survives a length control on one engine and vanishes on another, and reporting only the survivor would have been the easy mistake.
Why the pooled figure is not the headline
Measured, Volume III. Pooled across all engines, within-engine agreement is 0.468 (95% CI 0.427 to 0.505) over 136 repeat pairs, against between-engine agreement of 0.247 (95% CI 0.201 to 0.298) over 51 pairs. That looks like a clean separation and it is not one, because 54.4% of those within-engine pairs are Claude. Reasoned. A pooled mean is dominated by whichever engine contributed the most pairs and can report a separation that only one engine actually has. That is an unstated denominator, which is precisely the failure this chapter exists to name.
The sentence buyers actually need
Reasoned. There is a second reading of the within-engine column and it matters more commercially than the divergence result does. Measured, Volume III. Even the best case here is an engine agreeing with itself on roughly half its own shortlist across runs of the identical question, at 0.499 for Google AI Overviews and 0.442 for Claude. Reasoned. Every single-run visibility number in this industry, including the one in Volume I of this research programme, carries that variance and cannot show it. The same company measured twice can produce two different scores, and a single-run number cannot tell you how far apart the two could have been.
What this means if you are buying a visibility score
Reasoned. Anyone selling a number described as "your AI search visibility" without naming the engine, the date and the question set is selling a number whose denominator is unstated. Those three are not optional metadata. The engine determines which product was measured. The date determines which version of a continuously changing product was measured. The question set determines what "visibility" even means, because a company visible on use-case questions and invisible on best-of shortlists will score anywhere between 2 and 8 depending on the mix.
What a defensible score looks like
Reasoned. A defensible visibility measurement names its engine, states its collection window, publishes its question set, reports how many runs each question got, and either measures its own run-to-run variance or says openly that it did not. None of that is expensive. The reason it is rare is not cost. Chapter 12 of this manual turns this into a list of questions to put to a vendor before signing, and every one of them is answerable in a sentence by anyone doing the work properly.
What this chapter does not claim
Reasoned. It does not claim that engines are unreliable in a way that makes measurement pointless. Variance is not noise-in-the-pejorative-sense, it is a property of the system that can be quantified and reported, and this chapter quantifies it. It also does not claim that the two engines with no repeat data behave like the two that have it. Measured, Volume III. ChatGPT and Perplexity contributed zero repeat pairs. Nothing here licenses a statement about their run-to-run stability in either direction.
Limitation: a single collection window
Measured, Volume III. Everything here was collected between 05:28 and 16:29 UTC on 2026-08-04. Reasoned. These are products under continuous change. The numbers are a measurement of that window and should not be read as stable constants. A repeat of this study in three months could return materially different agreement figures without anything being wrong with either measurement, which is itself part of the argument the chapter is making.
Limitation: Google AI Overviews is scraped, not API-served
Measured, Volume III. There is no official API for Google AI Overviews, so it is collected by scraping rather than by a served endpoint. Reasoned. That introduces a dependency whose failure modes are not fully observable from the measurement side. Measured, Volume III. Where no overview was returned, the result is recorded with its own status rather than as an error, and treated as Google not producing one. Google returned an AI Overview for 92.1% of these buyer questions. On the remaining 22 there was no AI answer to be visible in at all.
Limitation: engines here are products and endpoints, not consumer apps
Measured, Volume III. The engines measured are production endpoints, not the consumer applications people actually type into. The retrieval layer, system prompt and ranking logic of the consumer products are not observable from outside. Results describe what these endpoints return and not what a person sees in an app. Reasoned. That distinction is routinely collapsed in industry reporting and it should not be, because the two can differ in ways nobody outside the providers can measure.
Limitation: the sampling frame generalises to nothing outside its own scope
Measured, Volume III. The categories and companies are inherited from Volume I, which was itself a convenience sample of B2B software categories. Reasoned. Nothing here generalises to consumer categories, to non-English queries, or to markets outside the United States English locale used for collection. The finding about run-to-run variance is likely to be general because it follows from how the systems work, but this study measured it in one place and says so.
Do this yourself: measure your own noise floor
Reasoned. Take five of your buyer questions. Put each one to the same engine three times, on the same day, within a couple of hours. Write down the set of vendors named in each answer. For each question, compare run one against run two, run one against run three, and run two against run three, and count how many vendors appear in both sets divided by how many appear in either. Average those. That average is your engine's noise floor on your questions, and it is the number every other visibility figure you are shown should be read against.
Do this yourself: audit the score you were sold
Reasoned. Ask four questions of whoever gave you a visibility number. Which engine produced it. On what date, in what window. What exactly were the questions, in full text. How many runs did each question get, and if the answer is one, what is the run-to-run variance on those questions. A supplier doing the work properly answers all four immediately. A supplier who cannot answer the fourth has sold you a point estimate from a distribution and has not told you the width of it.
Where to go next
Reasoned. If you want the requirements a measurement has to meet before it is worth reading at all, Chapter 8 at /valid-measurement/ turns the variance in this chapter into a specification. If you want the cross-engine picture that the single-engine noise floor sits inside, read Chapter 5 at /engine-divergence/. If you are about to buy this work from somebody, Chapter 12 at /how-to-buy-geo/ turns the four questions above into the full set to put to a supplier.
Sources and reproduction
Every number in this chapter comes from The 2026 State of GEO, Volume III, published with all collected answers, the extraction prompt, the scoring rules and the analysis scripts under CC BY 4.0. The bootstrap uses 2000 replicates with a fixed seed, so the confidence intervals reproduce exactly, and every figure is generated from the computed results file rather than typed, so a caption cannot drift from the dataset. All of it is at github.com/Broadcastwell/state-of-geo-2026 under volume-iii/.
About this manual
Author. Sairam Sivakumar, Broadcastwell.
Operator disclosure. Broadcastwell ran this measurement and sells services in the category it measures. Broadcastwell is excluded from the measured sample and from every ranking. The mitigation is not that the conflict is absent, it is that the raw data and the code are public and the result can be recomputed by anyone who disagrees.
Historical research record. The dated collection designs and source files remain available in the published research repository and the three volumes linked below. The July 2026 collection used four engines and five runs per question; the 18 August 2026 collection used the same ten questions and four engines, with one run per question.
Reading dated measurements. Reasoned. Compare like with like. A change in the number of runs changes the evidence base, even when the questions and engines are unchanged. Keep the collection date, question wording, engine, run count and exclusions beside any result. Inspect the retained answers and sources before interpreting a difference as movement. Naming and citation answer different questions, so report them separately. A dated observation supports a claim about that collection; it does not establish a current result or prove that an intervention caused a change.
Not peer reviewed. This is an independent industry study published as an open dataset with the analysis code that produced every figure in it. It has not been through academic peer review. Read it as measurement, and check the measurement. If you disagree with a number here, recompute it from the public data and publish what you get.
Licence. Prose and figures CC BY 4.0. Site code MIT.
The three volumes.
| Volume | What it covers | DOI |
|---|---|---|
| Volume I | 85 companies, 61 categories, 860 scored answers and 5,160 citations, one engine held constant. The dataset README additionally records 1,753 unique domains cited | 10.5281/zenodo.21537014 |
| Volume II | The Absence Ladder. All 616 absence records classified by question shape | 10.5281/zenodo.21586091 |
| Volume III | Cross-engine divergence. 280 questions, 40 categories, four engines, 853 answers | 10.5281/zenodo.21789120 |
Data and analysis code for all three volumes: github.com/Broadcastwell/state-of-geo-2026.
Version 1.0, August 2026.