What is in our research chart library?
Broadcastwell measures and fixes whether AI search engines name B2B software companies.
Run the free checkOur research chart library lists all 12 research data charts published on docs.broadcastwell.com as of 9 November 2026. Each row ties a chart to the page that publishes it and gives its caption or alt text, the data behind it, its date and base, and the credit line to use when you reuse it under CC BY 4.0. Four come from our September 2026 studies and eight from the Manual.
Updated 11 November 2026.
A chart is only as honest as the base printed beside it. Every chart below appears on its page next to the counts it draws, and we ask anyone who reuses one to carry that base and date with it.
How to reuse a chart
- Link the publishing page, not only the image. The page holds the base, the interval and the limits the chart leaves out.
- Keep the date and the base. A share without its denominator is the kind of figure our guide to checking a statistic warns about.
- Credit the source and say what you changed. CC BY 4.0 asks for credit, a link to the license and a note of any changes. Use: "Source: Broadcastwell, [page title], [page URL], CC BY 4.0. Changes: [none, or what you changed]."
- Pull numbers from the data, not the picture. Each row names its table; our open data catalog gives that table's rows, columns and SHA-256.
Charts from our September 2026 studies
These draw on Absence Index release 2026-09, whose answers were captured on 22 and 23 September 2026, or on a published third-party study we re-checked.
| Chart | Published on | Caption or alt text as published | Data | Date and base |
|---|---|---|---|---|
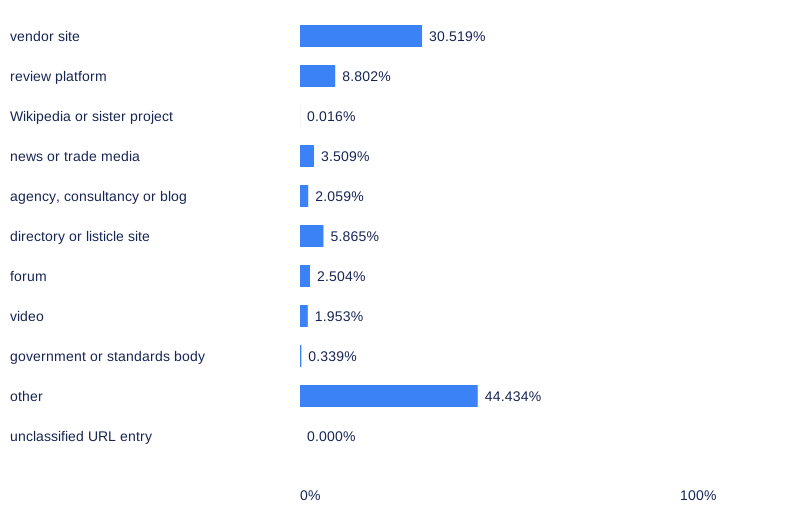
| citation-classes.svg | Who appears in the sources of B2B software answers? | "Other accounts for 44.4% of target citation entries, exceeding the checked-vendor class at 30.5%." | citation-class-shares.csv | 18,893 citation entries in 2,095 valid target answers; page published 30 October 2026 |
| vendor-concentration.svg | What does concentrated AI visibility mean for a buyer? | Alt text, summarized: in CRM, the three most-named checked vendors hold 67.0% of naming occurrences, and the share differs by category | vendor-concentration.csv | Checked-vendor naming occurrences per category, for example 319 of 476 in CRM; page published 30 October 2026 |
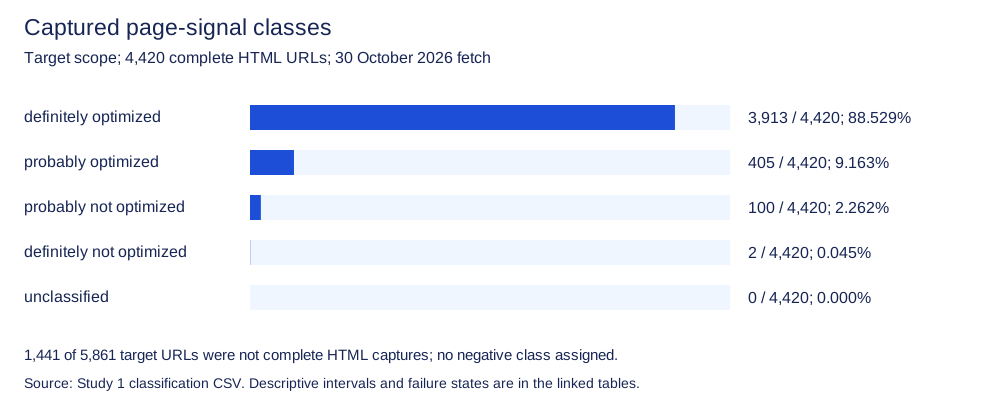
| study1-class-shares.svg | Which optimization signals occur on AI-cited pages? | "Target page-signal classes with the successful HTML denominator retained" | study1-class-shares.csv | 4,420 successfully fetched target URLs, pages fetched 30 October 2026; page published 2 November 2026 |
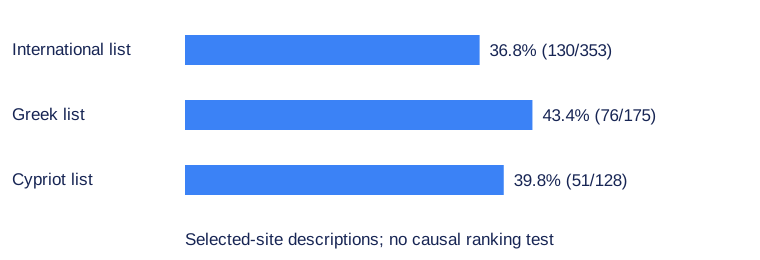
| news-commenting-2019.svg | Do newsroom commenting features prove a ranking gain? | "Social-account commenting appeared on 130 of 353 international-list sites, 76 of 175 Greek-list sites and 51 of 128 Cypriot-list sites." | news-commenting-2019.csv | Counts reported by Karyotakis and colleagues in an article published 30 August 2019, recomputed by us; page published 30 October 2026 |
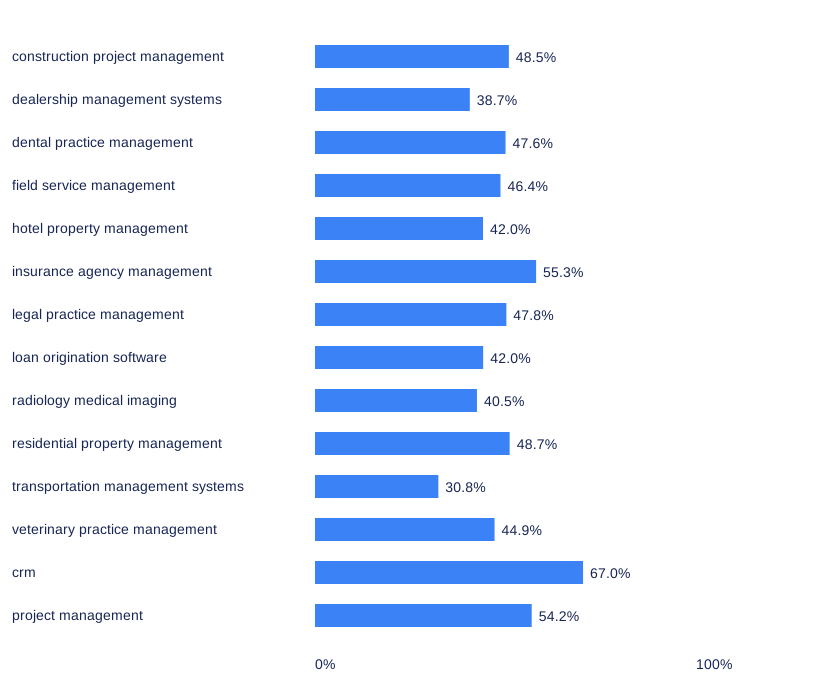
The concentration chart's alt text is summarized here rather than quoted; the chart and its page are unchanged.
Charts from the Manual
These eight figures come from the State of GEO volumes and sit in Manual chapters first published on 18 August 2026. Each volume states its own collection, engines and runs, so these figures are never combined with the September 2026 Index.
| Chart | Published on | Caption as published | Data | Date and base |
|---|---|---|---|---|
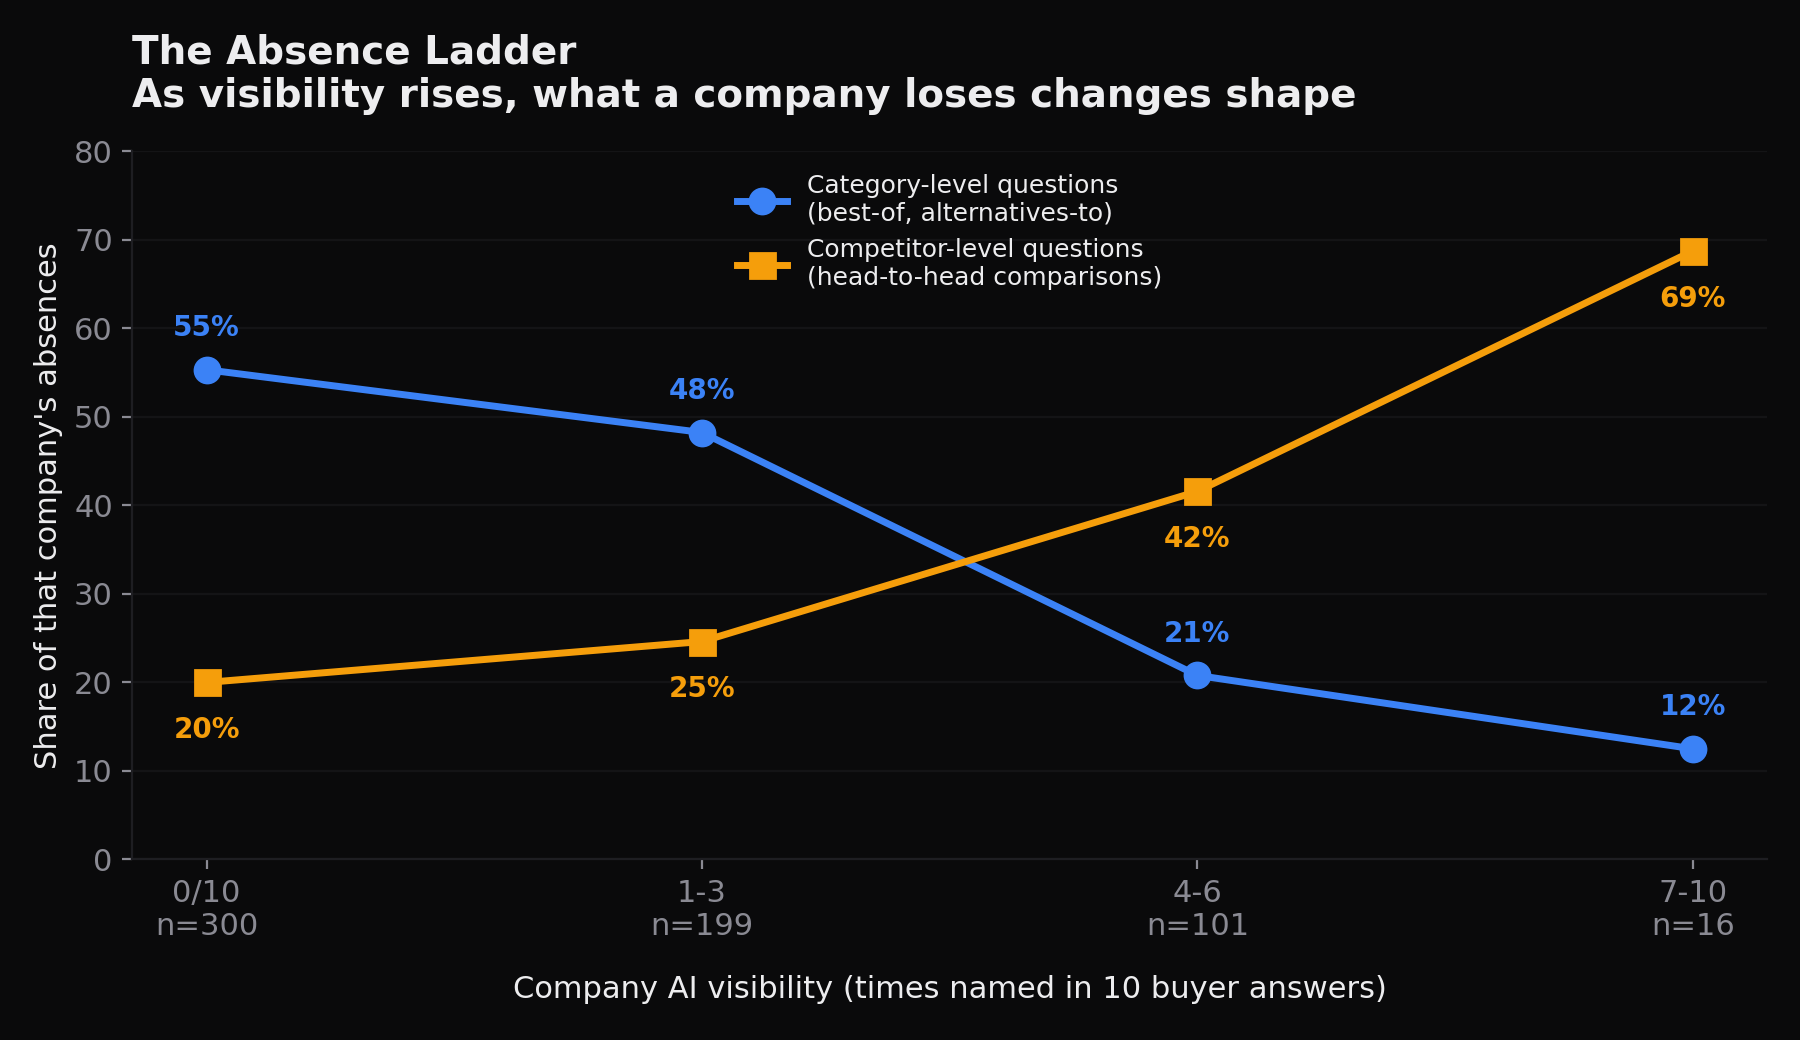
| absence-ladder.png | Which questions do unseen B2B companies lose? | "Figure 1. The absence ladder. Volume II, 616 absence records across 85 companies." | Volume II record | 616 absence records, in tiers of 300, 199, 101 and 16 |
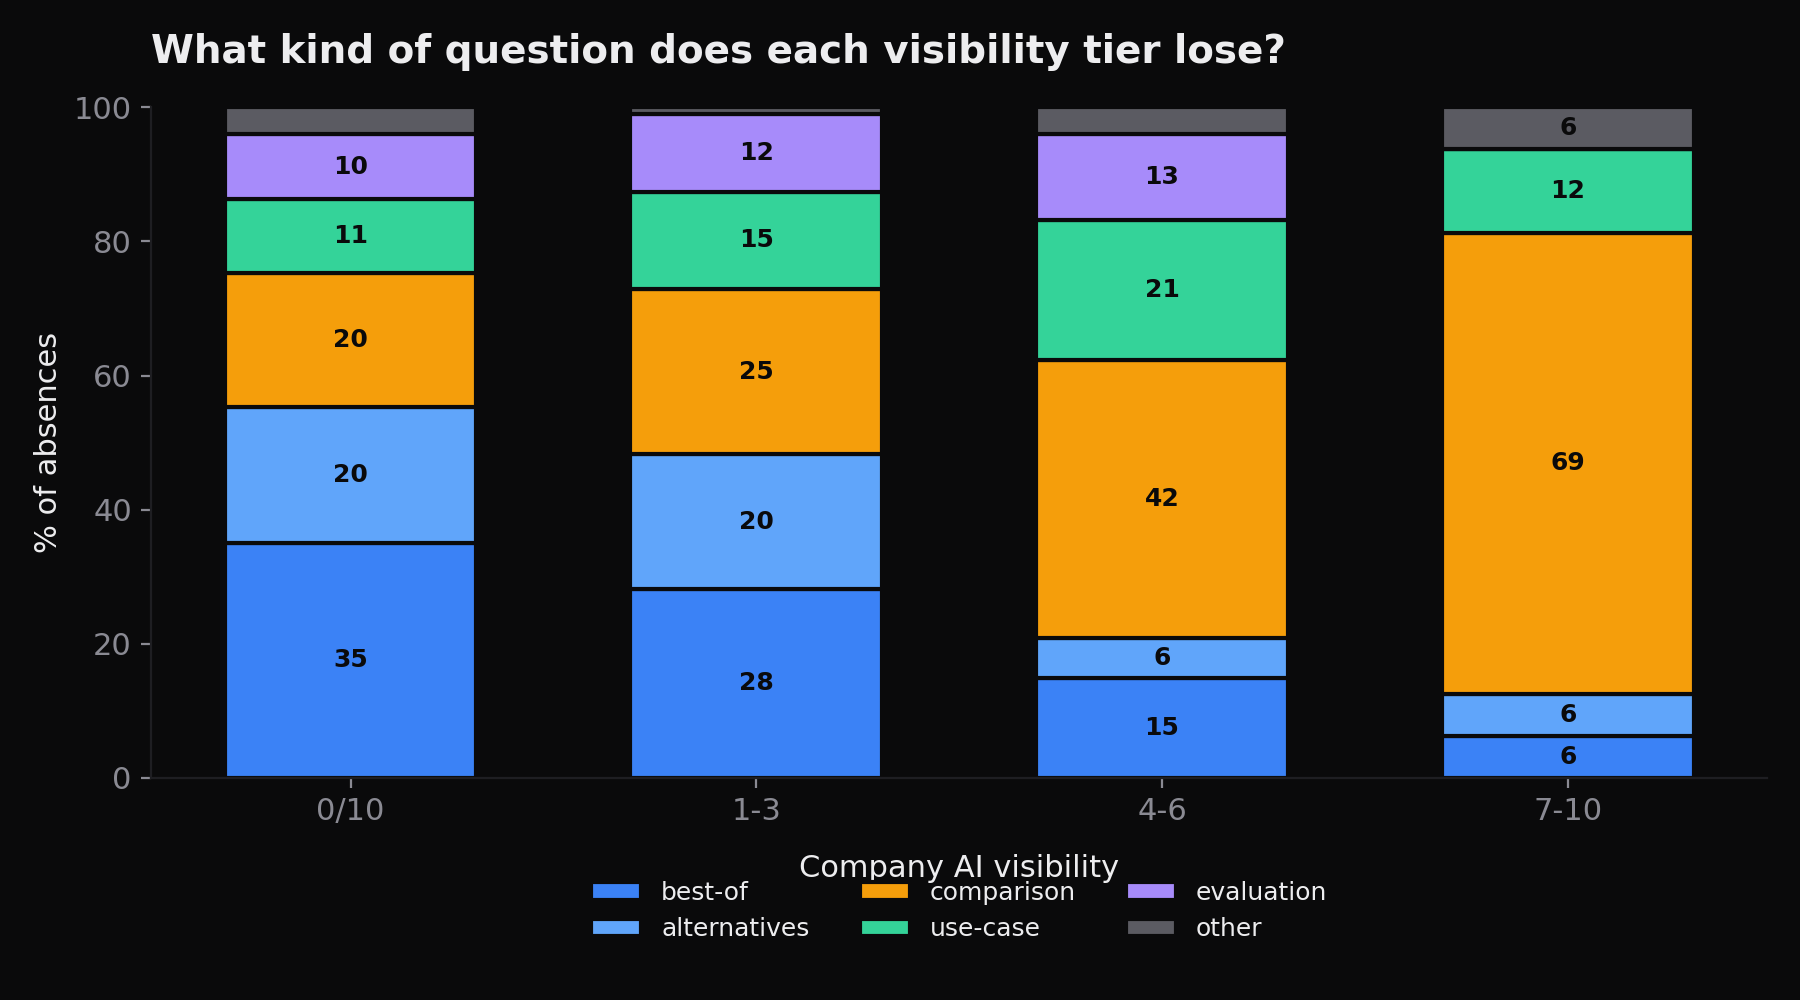
| shape-mix-by-tier.png | Which questions do unseen B2B companies lose? | "Figure 2. Shape mix by visibility tier. Volume II, 616 absence records." | Volume II record | The same 616 records by question shape and visibility tier |
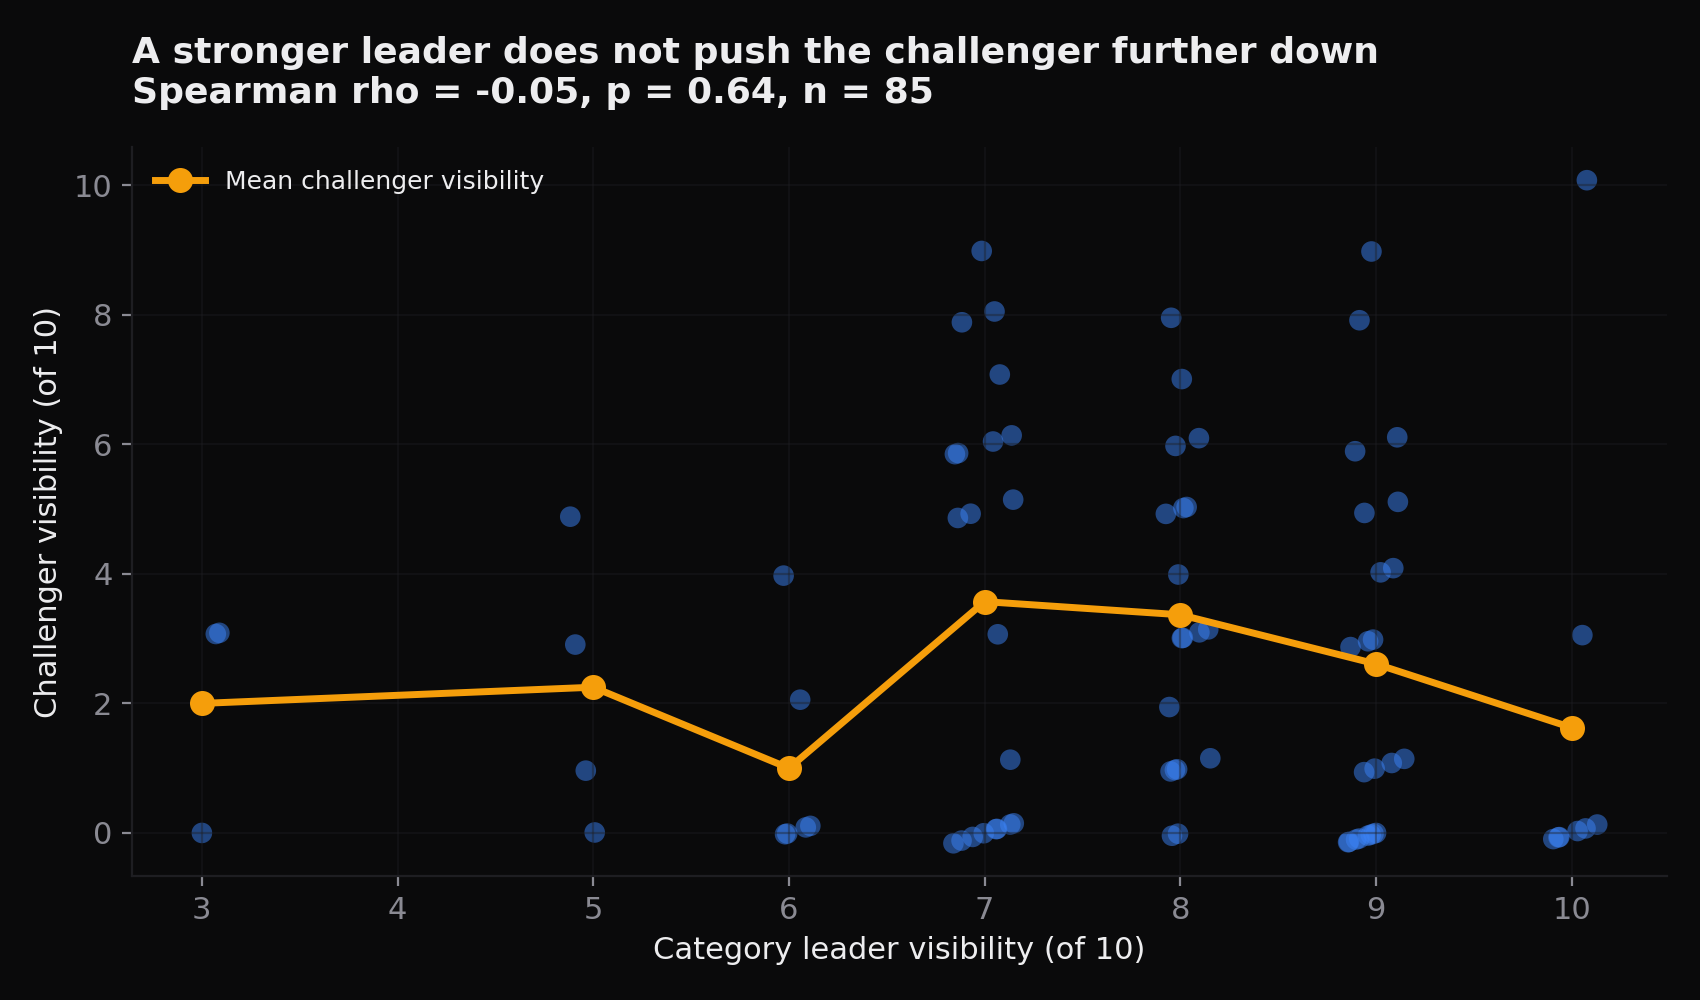
| leader-null.png | Why might AI answers omit a company from its category? | "Figure 1. Challenger visibility against leader visibility. Volume II, 85 companies, reported as a null result." | Volume II record | 85 companies; Spearman rho of minus 0.05 at p equals 0.64 |
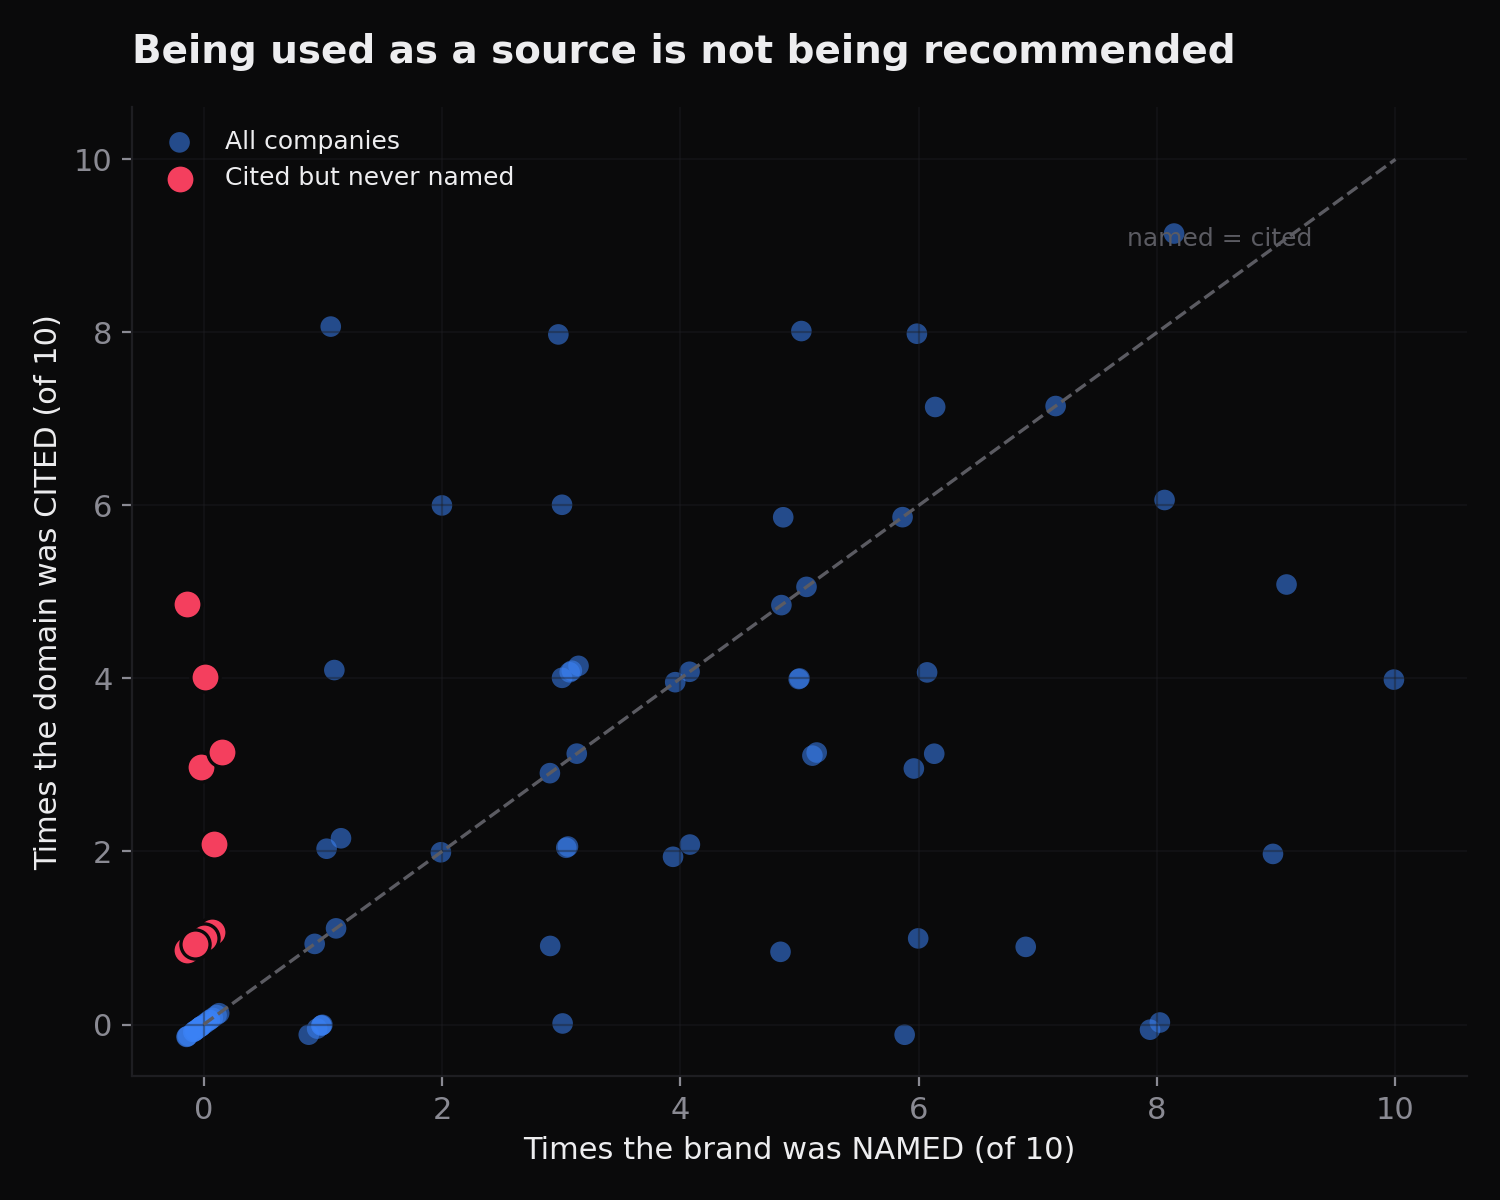
| named-vs-cited.png | Does an AI citation mean a product was recommended? | "Figure 1. Naming against citation, per company. Volume II, 85 companies." | Volume II record | 85 companies with ten answers each |
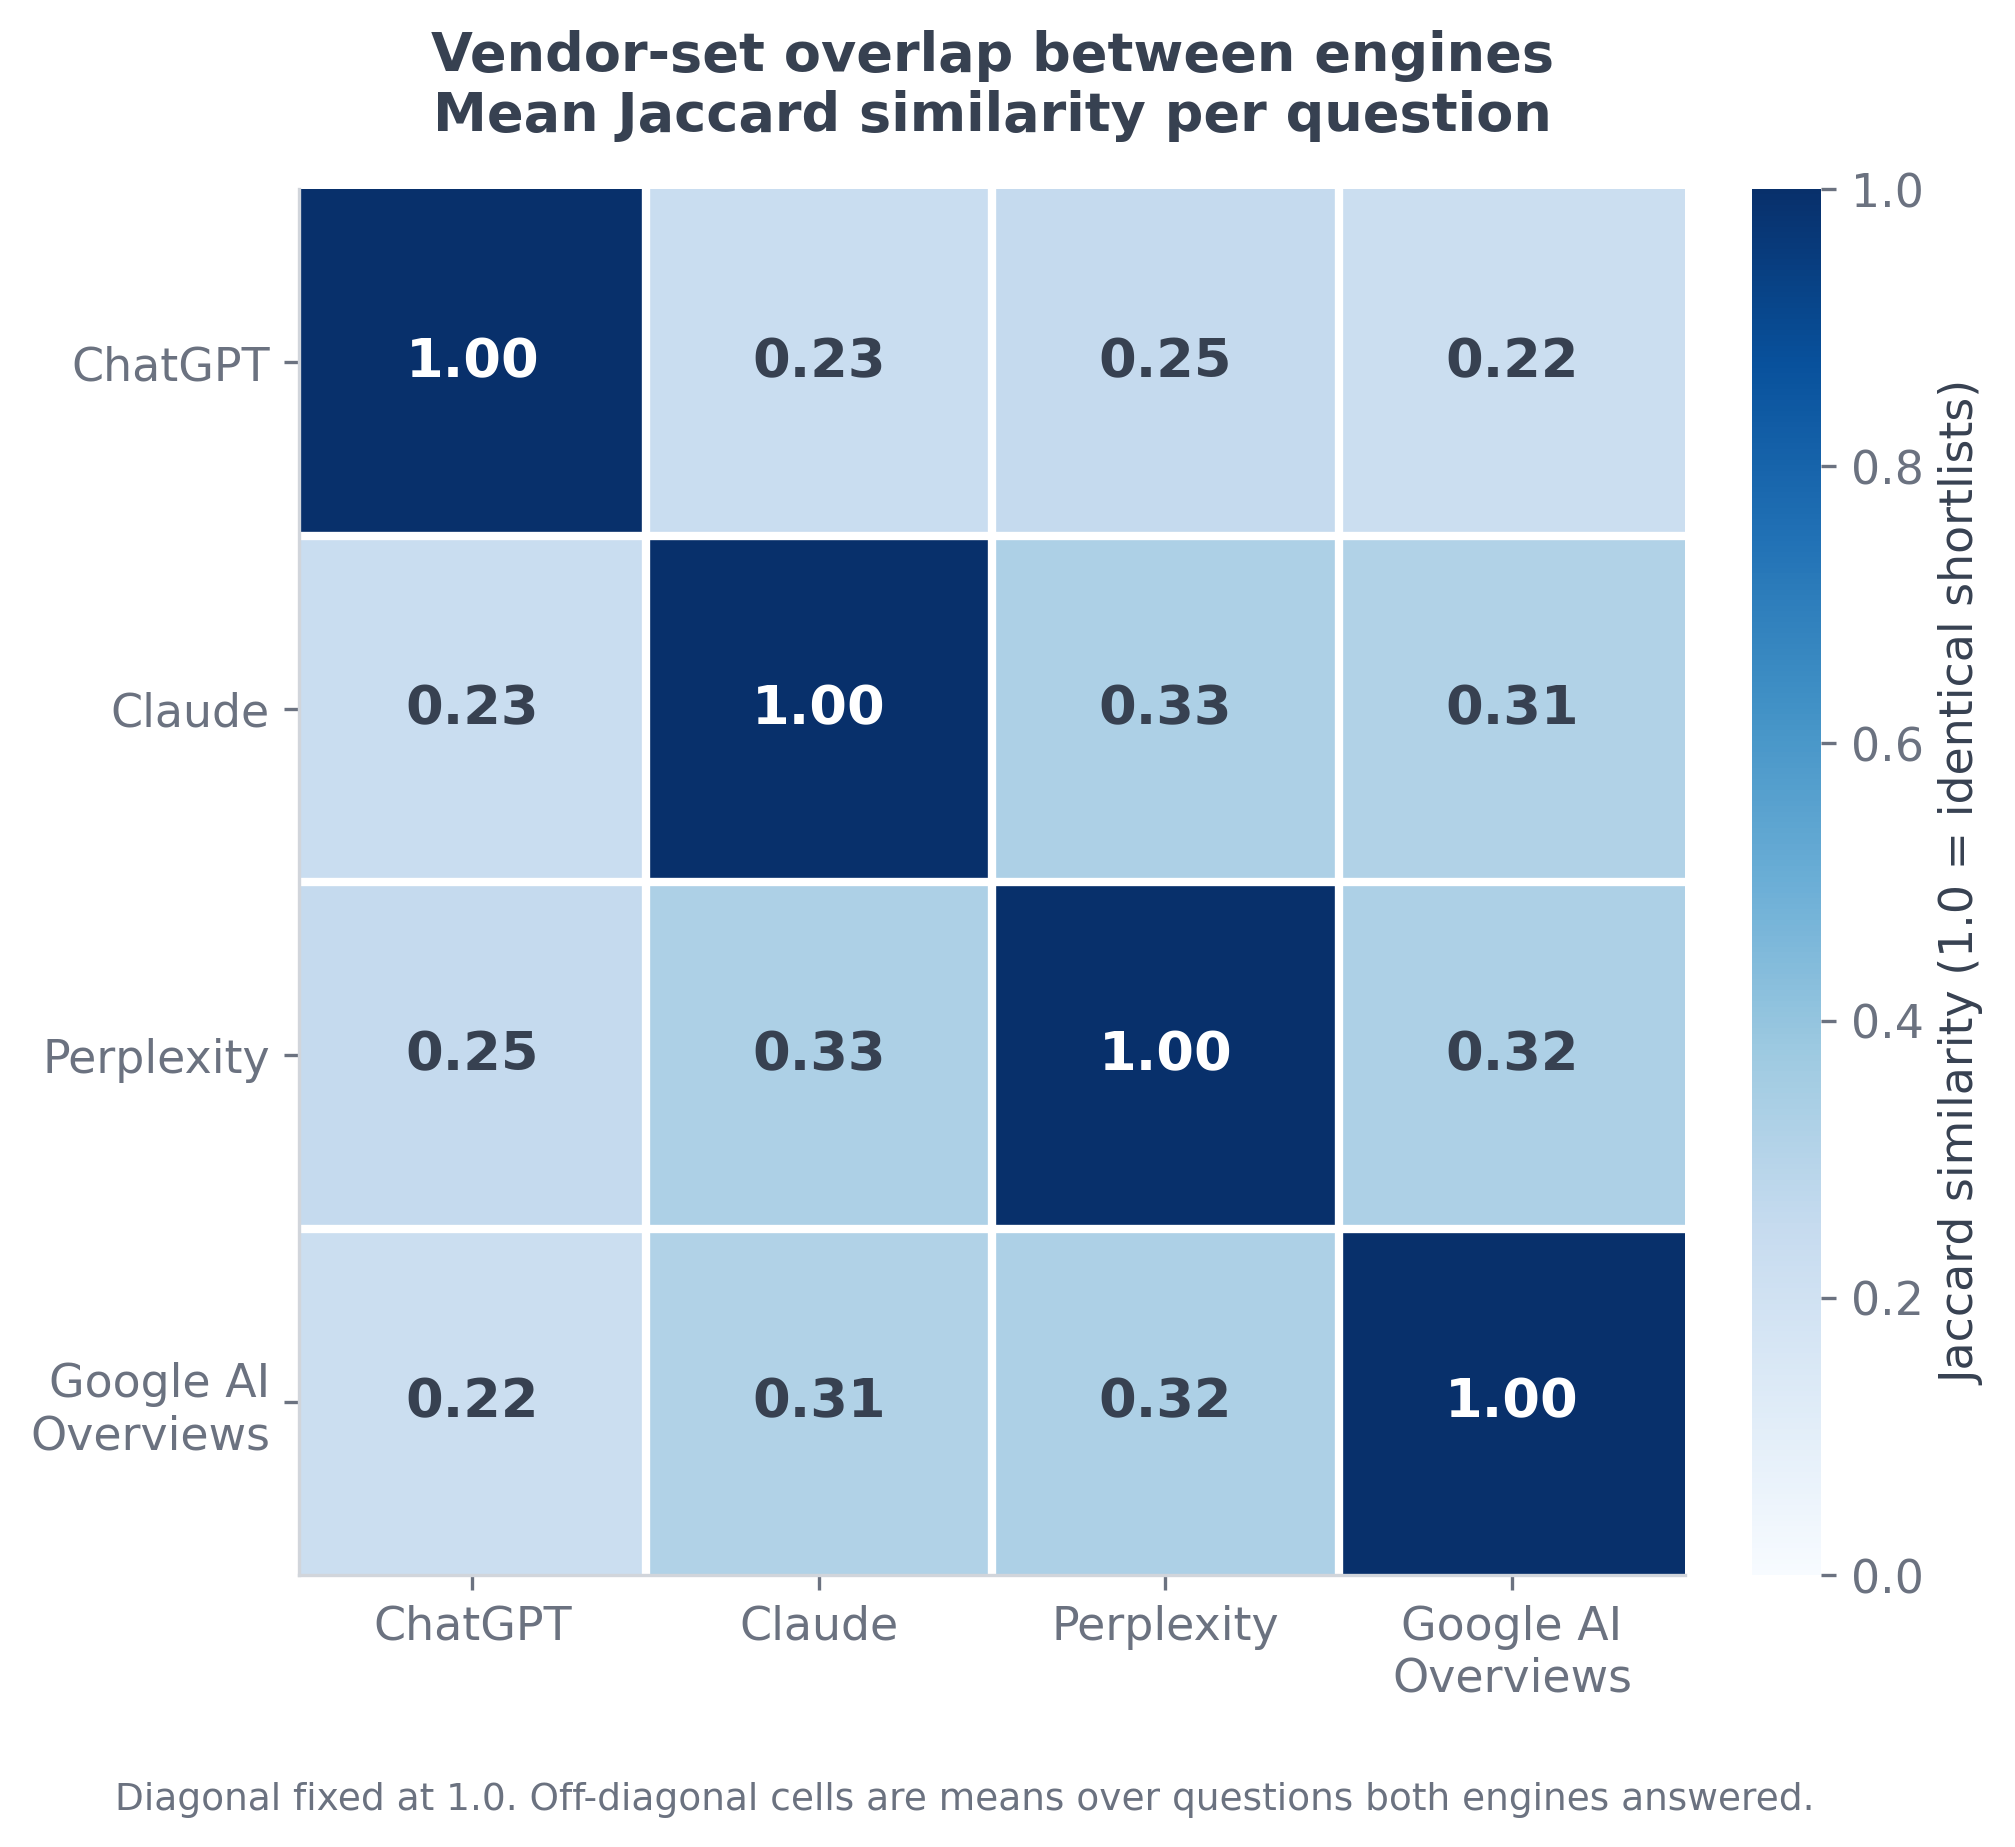
| jaccard-matrix.png | Do AI search engines name the same software vendors? | "Figure 1. Mean vendor-set overlap per question, all engine pairs. Volume III." | Volume III record | 280 questions in 40 categories, collected 05:28 to 16:29 UTC on 4 August 2026 |
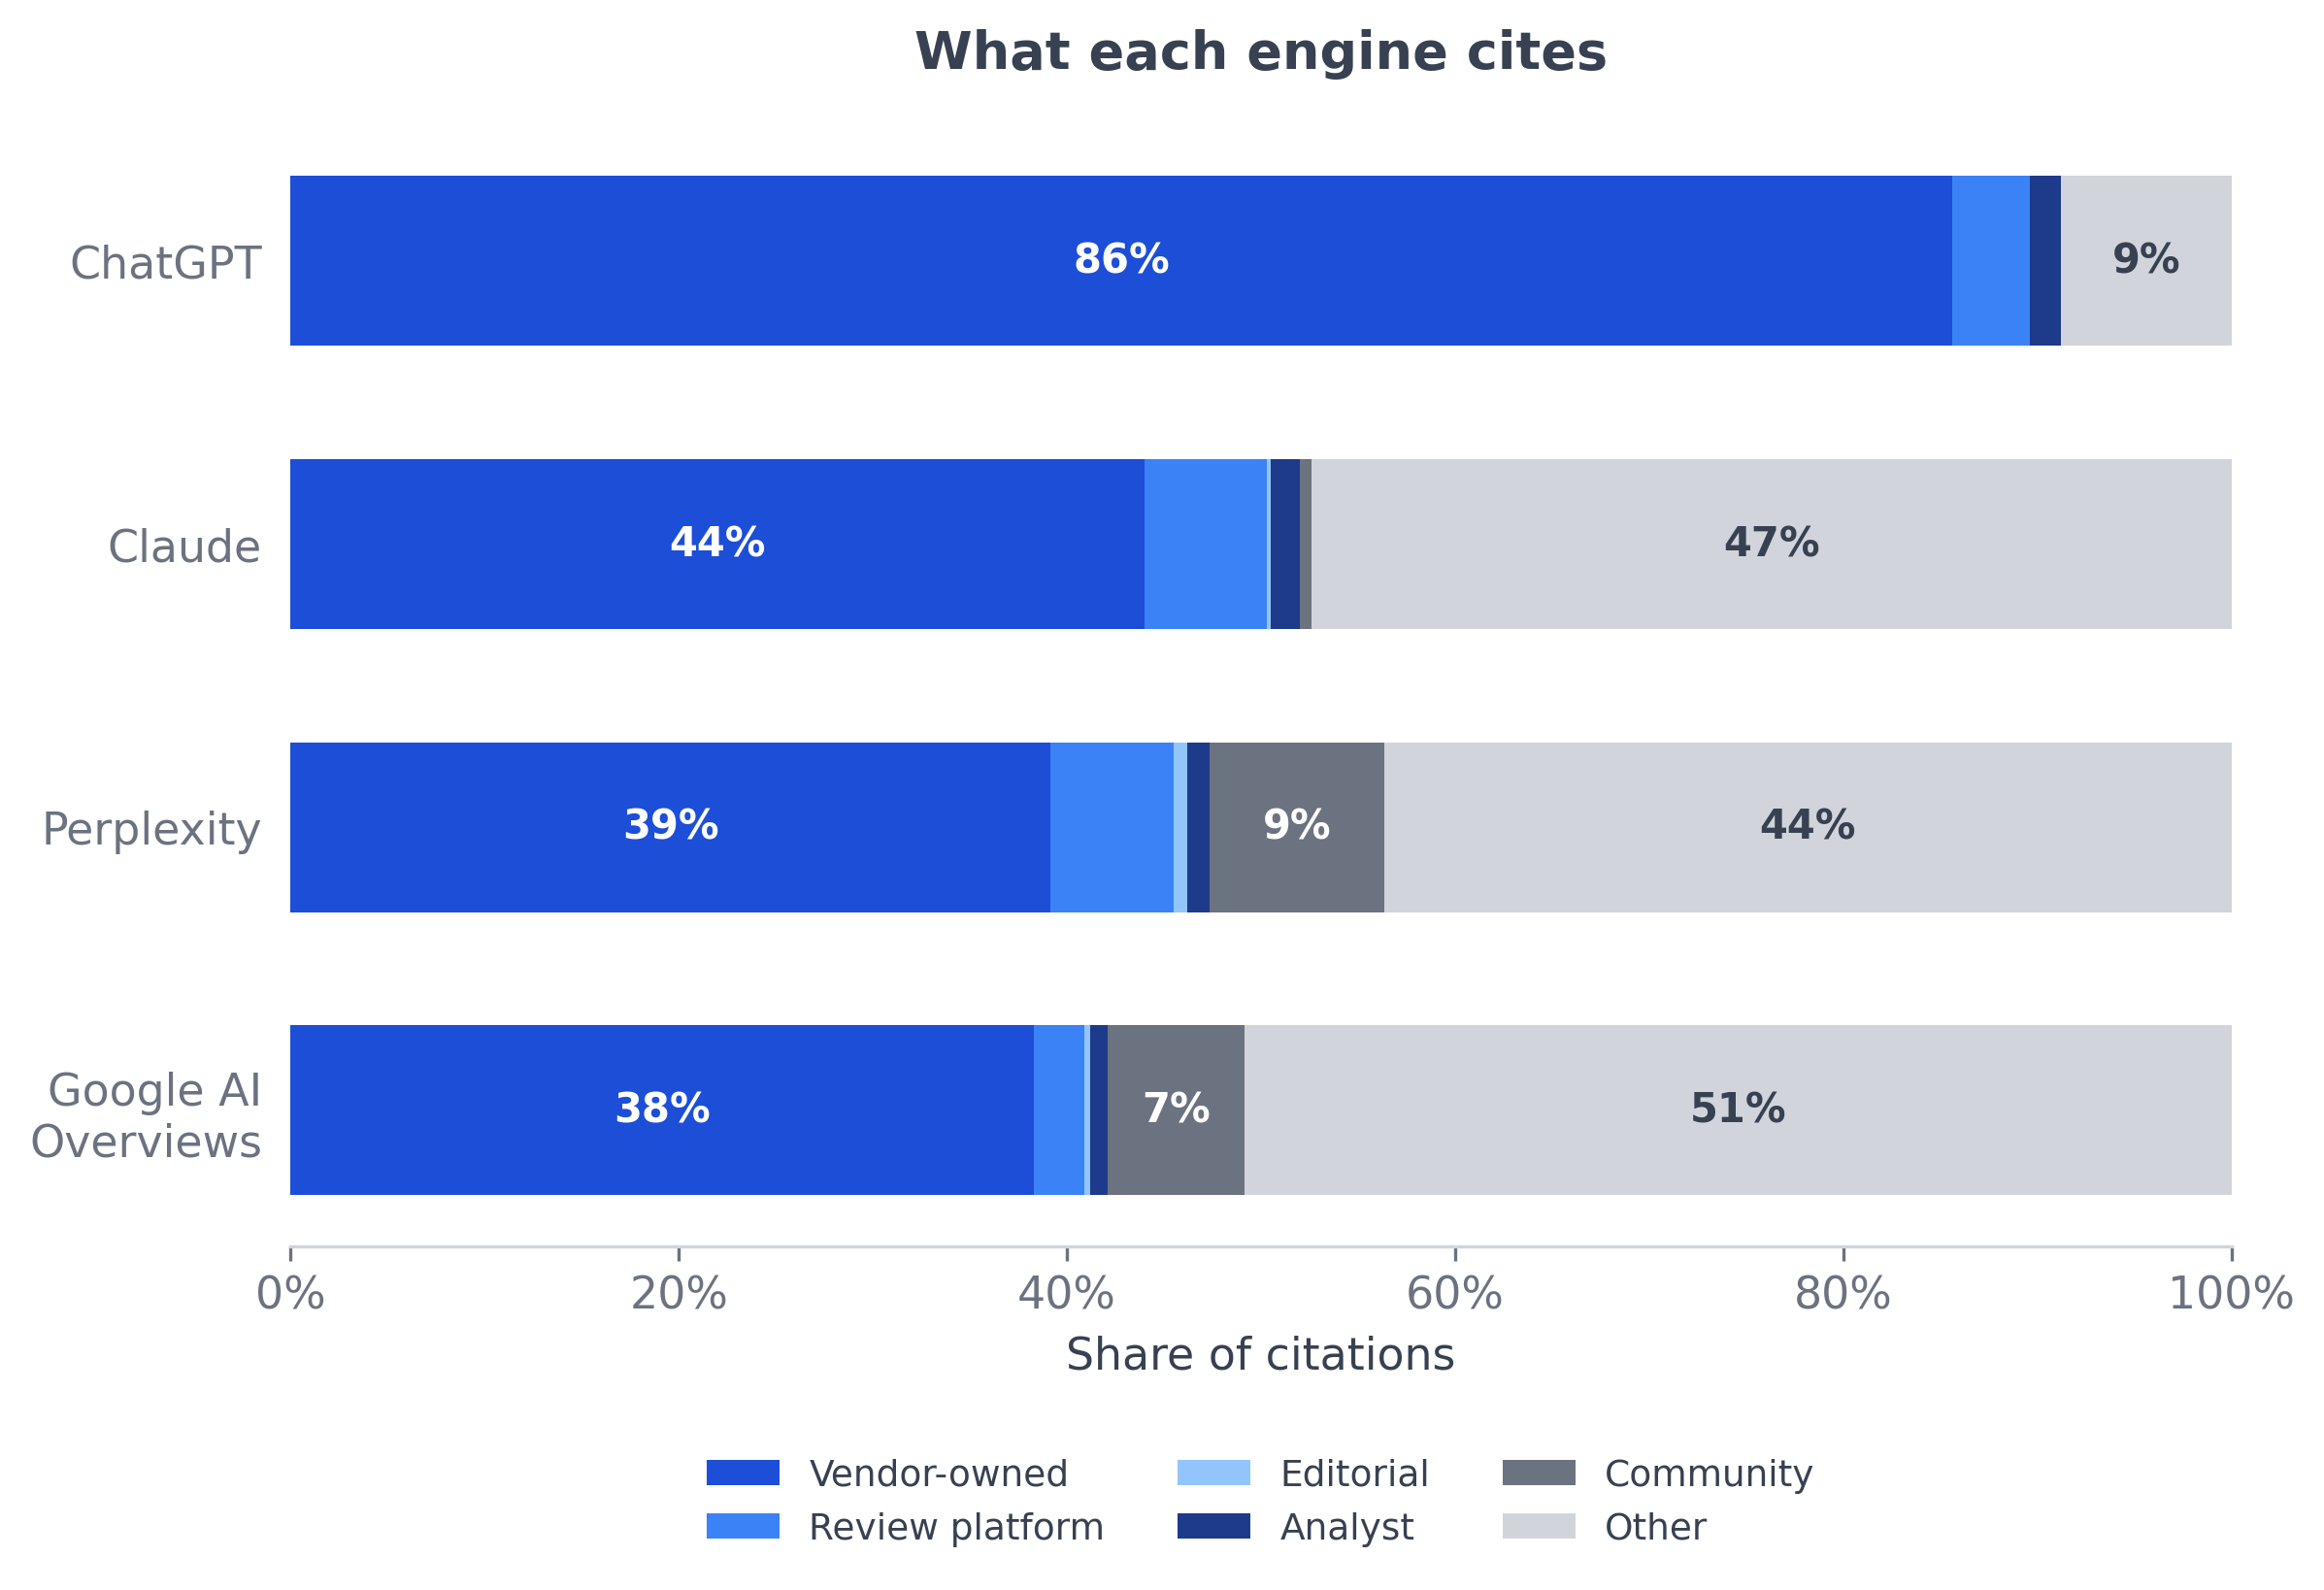
| citation-mix-by-engine.png | Do AI search engines name the same software vendors? | "Figure 2. Citation source mix per engine. Volume III." | Volume III record | Citations per engine: 125 ChatGPT, 3,563 Claude, 3,016 Perplexity, 2,849 Google AI Overviews |
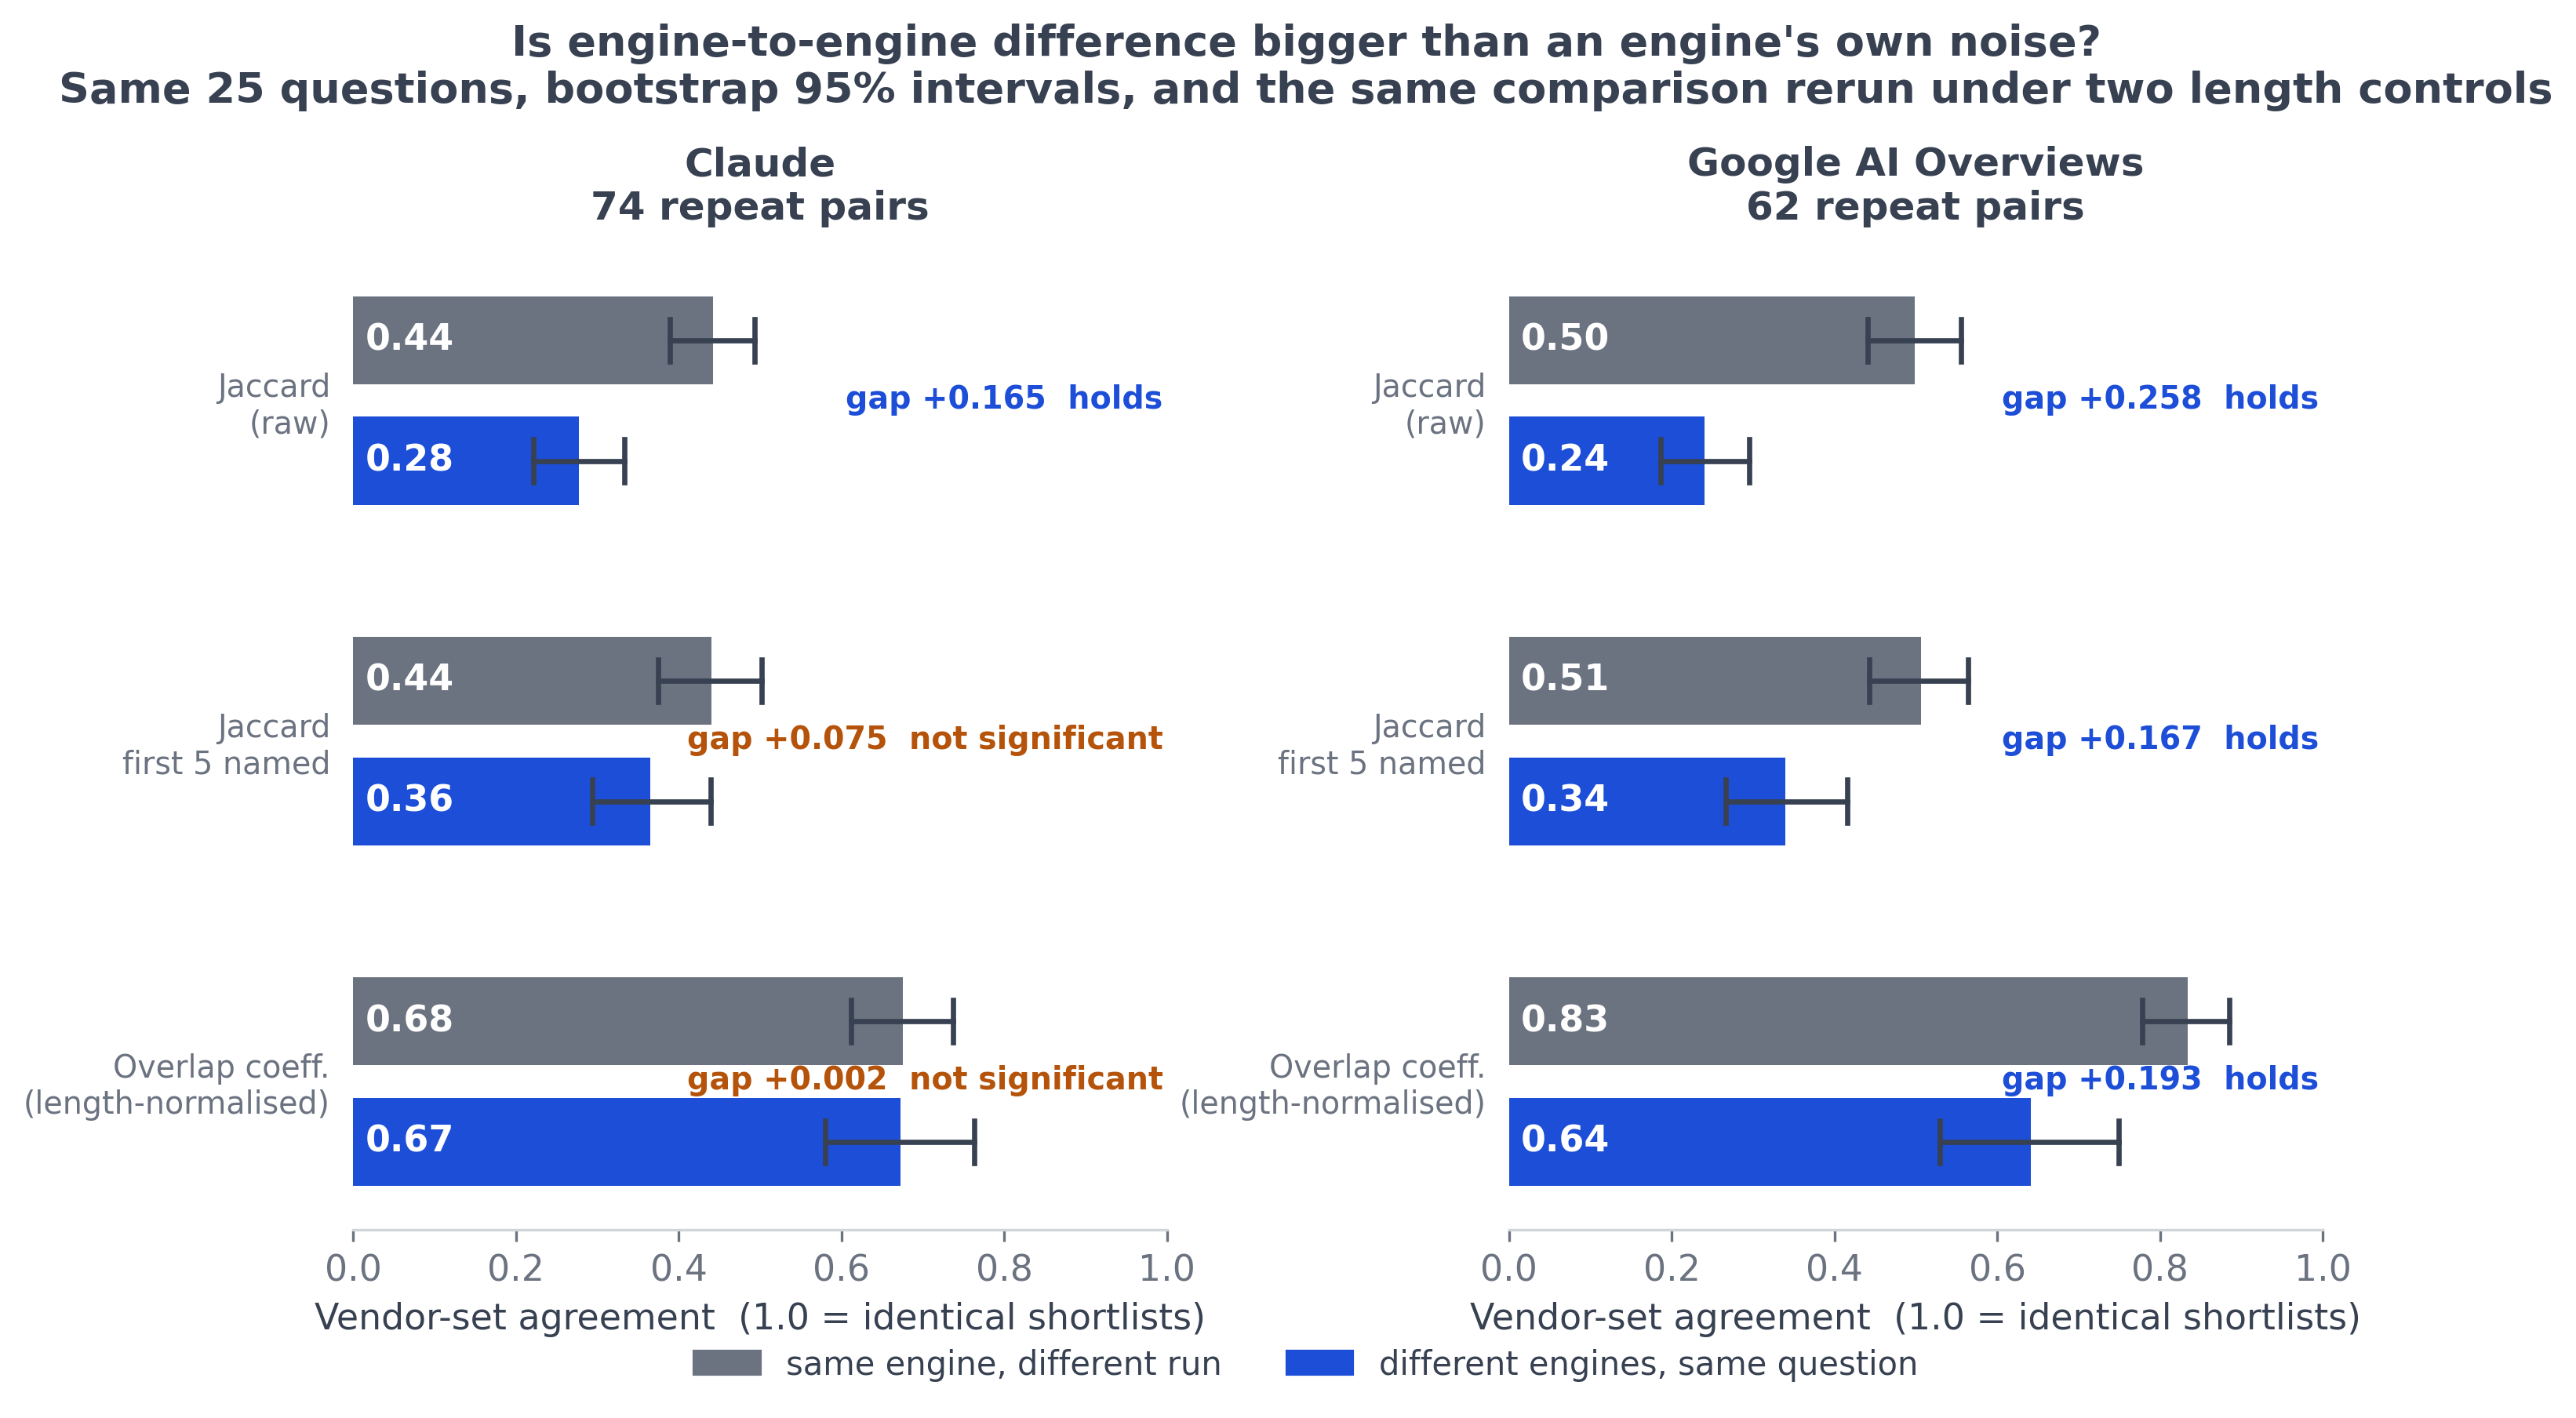
| within-vs-between.png | How much can an AI shortlist change between repeats? | "Figure 1. Within-engine versus between-engine agreement, per engine, under three measures. Volume III, same 25 questions, bootstrap 95% intervals." | Volume III record | 25 questions repeated on each engine |
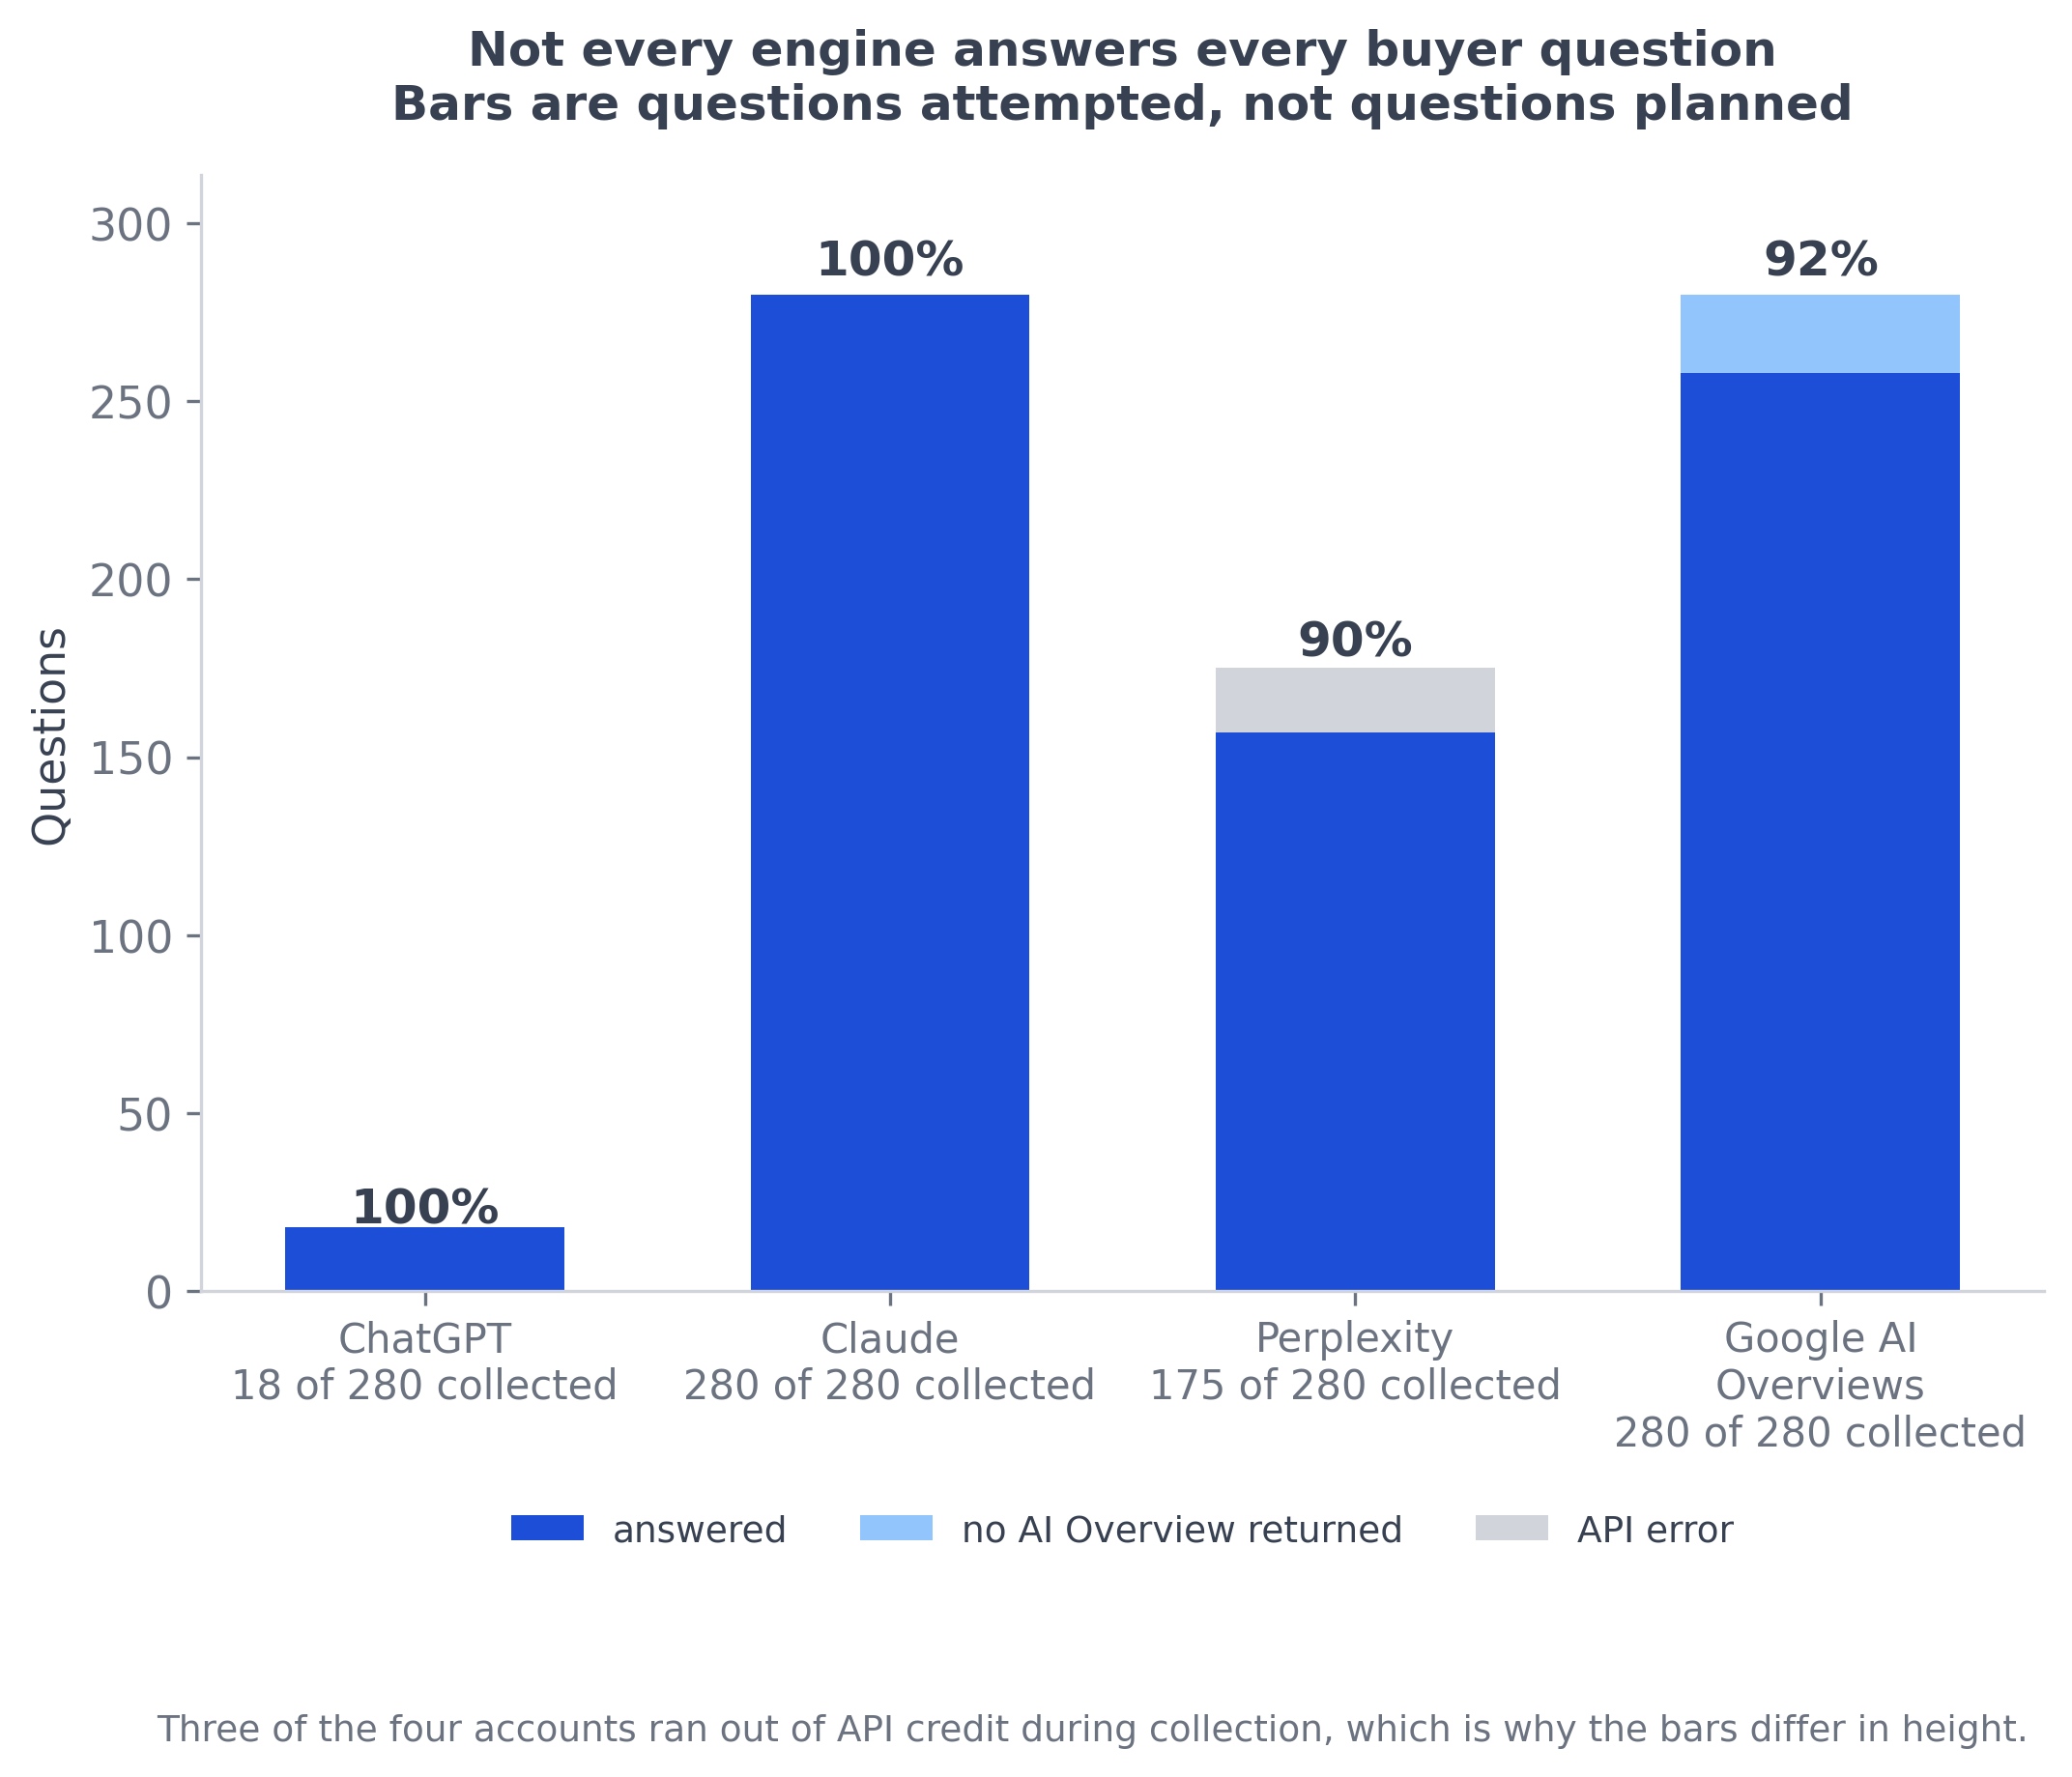
| answer-rate.png | Does Google show an AI Overview for every query? | "Figure 1. Answered against attempted, per engine. Volume III." | Volume III record | Questions attempted per engine; Google AI Overviews answered 258 of 280 |
The Volume II and III data and code are also in the State of GEO repository.
What the library leaves out
- Process diagrams. The six illustrations in our practical guides, such as the one in how to read an AI answer without overreading it, show steps rather than data, so they carry no base and are not listed.
- Client charts. Charts from client reports are never published without the client's written approval.
- Charts that appear only inside a PDF report. Each study PDF keeps its own figures and captions, and the chart files stored beside those PDFs are not published on a docs page with a base. Cite the report by its DOI, listed on our page on how to cite our research.
- Fictional samples. The source chart on our completed-case format page shows the fictional Kalvenor sample (Sample data, fictional company), not research data.
Credit lines, ready to paste
- Study chart: "Source: Broadcastwell, Who appears in the sources of B2B software answers?, https://docs.broadcastwell.com/
research/studies/ who-ai-engines-cite/, data from Absence Index release 2026-09 (doi:10.5281/zenodo.22907695), CC BY 4.0." - Manual chart: "Source: Sivakumar, S. (2026). The Absence Manual. Broadcastwell. https://docs.broadcastwell.com/, figure from The 2026 State of GEO, Volume III (doi:10.5281/zenodo.21789120), CC BY 4.0."
Every term in these captions, from base to citation, is defined in our AI search glossary.
Sources
- Broadcastwell, the eight Manual chapters and four research pages linked in the tables, read on 9 November 2026 for captions, alt text, dates and bases.
- Broadcastwell, Absence Index release 2026-09, published 23 September 2026.
- Sivakumar, S. (2026), The 2026 State of GEO, Volume II and Volume III, Zenodo.
- Broadcastwell, content license for The Absence Manual: prose and figures under CC BY 4.0.
- Creative Commons, Attribution 4.0 International.